Main Points :
- Bitcoin sharply dropped below $80,600 and is attempting a rebound, but faces heavy resistance at the 20-day EMA ($94,620).
- Ethereum struggles under a strong resistance band at $3,148–$3,350, with key trend reversal only above the 50-day SMA ($3,659).
- XRP remains inside a descending channel, with bears attempting to push the price back to $1.61 unless the trendline is broken.
- Solana is weakly defending $126, with a risk of falling to $110–$95 unless it reclaims the 20-day EMA ($145).
- Broader market sentiment suggests volatility but also sets up opportunity zones for high-conviction altcoins.
- Global macro and U.S. regulatory shifts continue to influence market structure, contributing to liquidity pockets and investment rotations.
Introduction
The cryptocurrency market has entered one of its most pivotal phases in recent months, marked by expanding institutional adoption, continued macroeconomic uncertainty, and a notable shift in technical indicators across the top digital assets. Over the past week, Bitcoin, Ethereum, XRP, and Solana experienced sharp volatility that pushed each asset toward critical support and resistance zones.
This article analyzes the latest chart patterns, integrates recent cross-market developments, and highlights practical insights for investors seeking new revenue opportunities, promising altcoins, and blockchain assets with real-world utility.
Bitcoin (BTC): Testing Whether $80,000 is a Durable Bottom
1. Price Action Overview
Bitcoin’s sharp decline to $80,600 triggered a rapid response from both short-term traders and long-term holders. Although BTC rebounded from the lows, the recovery remains fragile due to heavy resistance at the 20-day EMA ($94,620).
Insert Chart 1 Here:
→ Insert /mnt/data/btc_chart.png
The BTC chart shows that every attempt to regain higher ground is met with consistent selling pressure. This reveals a market environment dominated by caution rather than blind optimism.
2. Bearish Case
If Bitcoin fails to break and sustain above the 20-day EMA, the bearish scenario activates:
- Increased probability of another drop
- First major support: $73,777
- If broken: deeper pullback toward the $70,000 psychological zone
Weak rebounds show that institutional buyers are not yet aggressively accumulating.
3. Bullish Case
If BTC climbs above the 20-day EMA and holds:
- Market sentiment shifts decisively bullish
- Next major target becomes $100,000, a key psychological milestone
- Volatility may increase dramatically once the six-figure test begins
Ethereum (ETH): A Struggle at the Resistance Wall
1. Price Structure
Ethereum is attempting to build a rebound, but faces a cluster of resistance between:
- $3,148 (20-day EMA)
- $3,350 upper resistance zone
Insert Chart 2 Here:
→ Insert /mnt/data/eth_chart.png
This zone has historically triggered aggressive selling, and the current market structure suggests bears will attempt to resume the downtrend if ETH fails to break above it.
2. Bearish Continuation
A close below $2,623 would:
- Mark the beginning of another downward cycle
- Set targets at $2,400 and then $2,111
These levels are critical for medium-term traders who rely on lower accumulation zones.
3. Bullish Reversal Zone
A decisive break above:
- $3,350, then
- $3,659 (50-day SMA)
…would mark the return of bullish dominance and reset the trend structure. ETH has historically reacted strongly following reclaim of the 50-day SMA.
XRP (Ripple): Watching the Descending Channel
1. Current Technical Setup
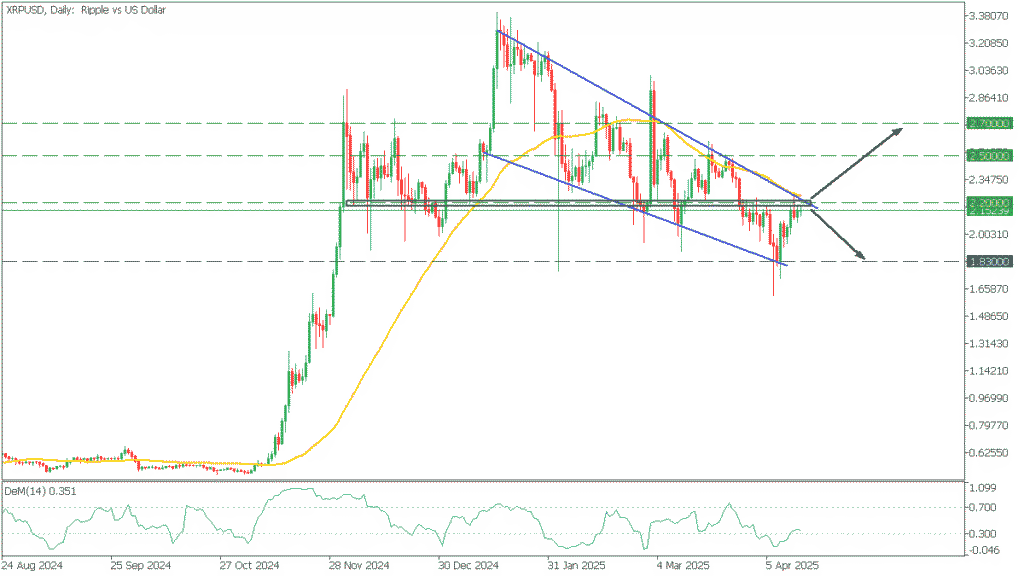
XRP recently bounced from its support line, showing that bulls are not ready to capitulate. However, the pair remains stuck within a descending channel.
Bears will attempt to stall this rebound near the moving averages.
2. Bearish Risk
A sharp rejection from the moving averages could push XRP back toward:
- $1.61 support
This remains the line where aggressive buyers previously stepped in.
3. Bullish Breakout Requirements
For XRP to confirm a real trend reversal:
- Price must break above the descending trendline
- Sustained trading above this line is essential
- Only then can the bullish structure be confirmed
Solana (SOL): A Weak Rebound Signals Caution
1. Market Behavior
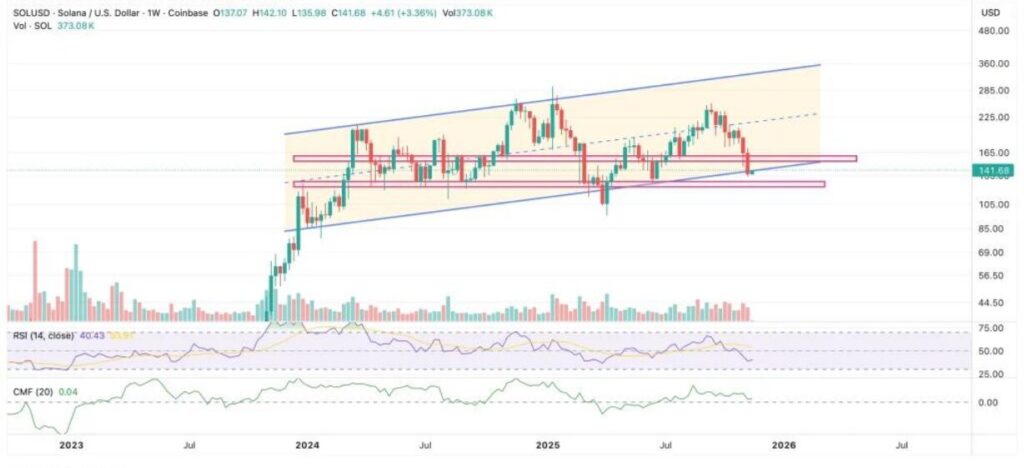
Solana is currently attempting to defend $126, but rebound momentum is weak.
This suggests:
- Lack of strong bullish accumulation
- High sensitivity to market-wide volatility
2. Bearish Outlook
Failure at current levels or at the 20-day EMA ($145) sets the stage for:
- A retest of $110
- A deeper decline to $95 if sentiment worsens
These levels attract value investors, but the trend remains fragile.
3. Bullish Reclaim Threshold
A close above the 20-day EMA ($145) suggests bulls are regaining initiative.
Next target becomes:
- $174 (50-day SMA)
The SMA reclaim usually aligns with mid-term momentum shifts.
Recent Broader Market Developments
1. U.S. Regulatory Developments
In the last month, several important regulatory changes have started influencing crypto markets:
- Increased clarity on digital asset taxation
- Renewed discussions on ETF market expansion
- Institutional interest in altcoin-based ETPs
These changes open new pathways for altcoins like SOL, AVAX, ARB, and HBAR.
2. Global Liquidity Environment
Despite macro uncertainty:
- U.S. treasury yields remain volatile
- Global investors rotate into alternative high-beta assets
- Crypto continues to attract capital seeking asymmetric return potential
3. Institutional Adoption
A growing number of financial institutions—both U.S. and APAC—are expanding into:
- Tokenized assets
- Stablecoin payment rails
- Cross-chain liquidity infrastructure
This broader ecosystem growth supports long-term valuation for BTC, ETH, and other leading networks.
Conclusion
The crypto market stands at a crossroads:
Massive volatility is shaking out weak positions, while long-term investors accumulate at key technical zones.
Across BTC, ETH, XRP, and SOL, we see a common pattern:
- Strong support tests
- Heavy resistance overhead
- Neutral-to-bearish short-term momentum
- Potential for explosive breakouts if resistance levels flip
For investors seeking emerging revenue opportunities or new altcoins with real-world utility, this environment is ideal—but only if approached with disciplined risk management.
As always, understanding macro trends, chart structures, and institutional flows provides the strategic advantage needed to navigate this rapidly shifting market.