Main Points :
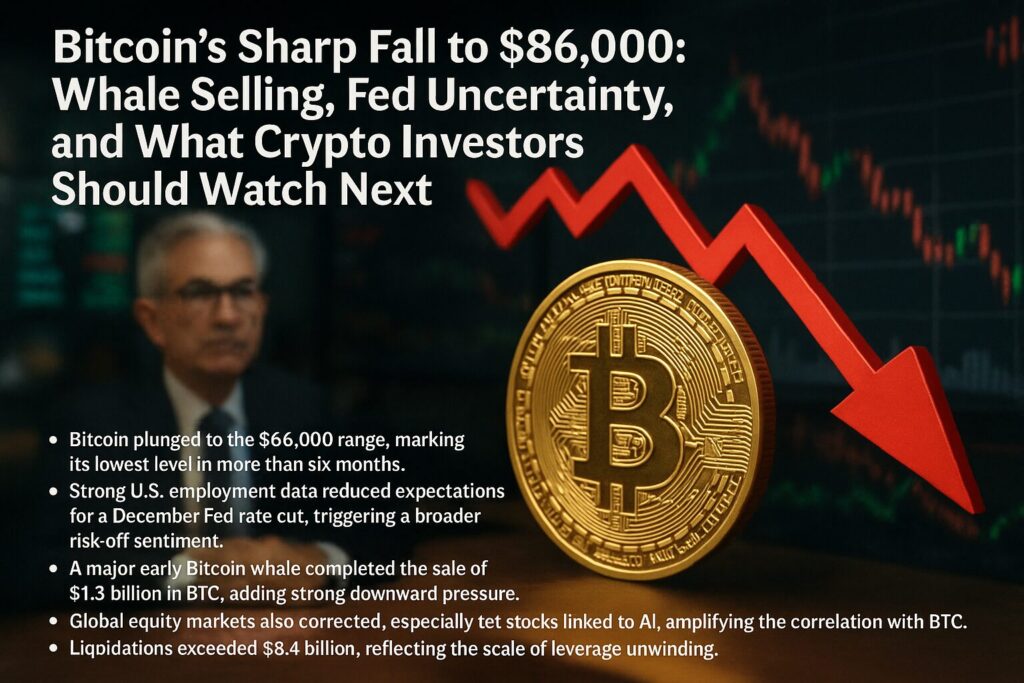
- Bitcoin plunged to the $86,000 range, marking its lowest level in more than six months.
- Strong U.S. employment data reduced expectations for a December Fed rate cut, triggering a broader risk-off sentiment.
- A major early Bitcoin whale completed the sale of $1.3 billion in BTC, adding strong downward pressure.
- Global equity markets also corrected, especially tech stocks linked to AI, amplifying the correlation with BTC.
- Liquidations exceeded $8.4 billion, reflecting the scale of leverage unwinding.
- Despite short-term volatility, long-term BTC fundamentals remain solid, creating potential opportunity zones for strategic investors.
Introduction: A Sudden Shock to the Market
Bitcoin experienced a dramatic downturn on November 21, falling sharply to $86,155, its lowest level in over seven months. This move sent shockwaves through the cryptocurrency market as traders, whales, and institutional players reassessed their risk exposure.
Multiple factors converged simultaneously:
- A surprising surge in U.S. job data
- Declining probability of a December Federal Reserve rate cut
- A renewed spike in the volatility index (VIX)
- Significant whale-driven BTC selling pressure
- A parallel correction in U.S. stock markets, especially tech and AI-related equities
Combined, these elements created the perfect storm.

1. Macro Backdrop: Why the U.S. Economy Shook Bitcoin
1.1 Employment Data Surprised the Market
On the night of November 20, U.S. job statistics revealed that 119,000 jobs were added in September—far above the expected 50,000. While strong employment is good for the real economy, it raises concerns for Bitcoin for two reasons:
- Reduced likelihood of rate cuts
- Strengthening U.S. dollar and tightening liquidity
The CME FedWatch tool showed market expectations for a December rate cut falling to around 40%, a marked shift from earlier optimism.
1.2 Higher VIX = Lower BTC
Bitcoin tends to move inversely with the VIX.
The VIX spiked above 27, the highest in more than a month, reflecting growing risk aversion.
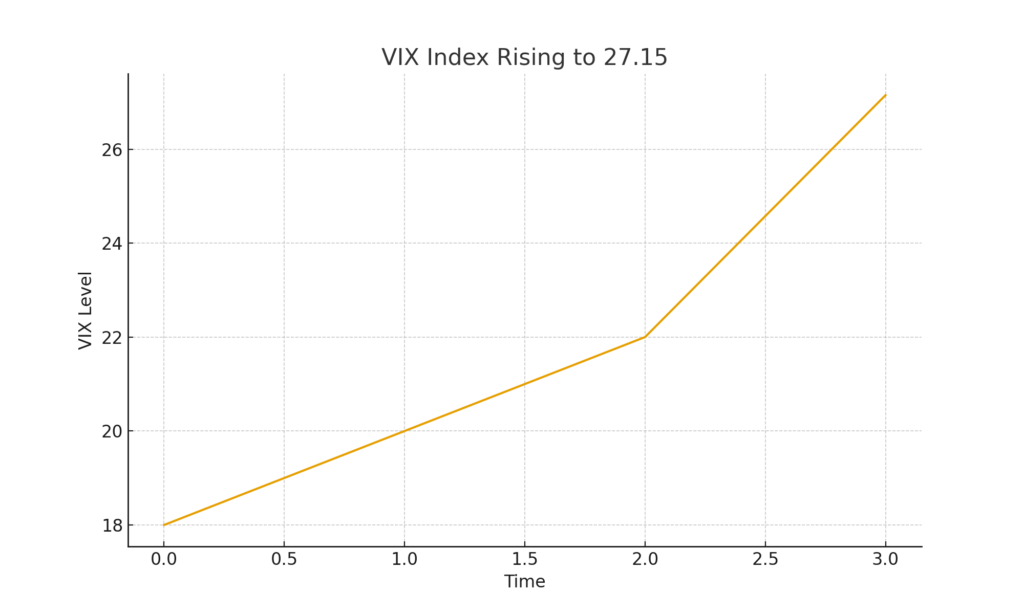
High VIX means traders flee to safer assets—often at the expense of crypto.
2. Whale Activity: The Trigger for the Final Drop
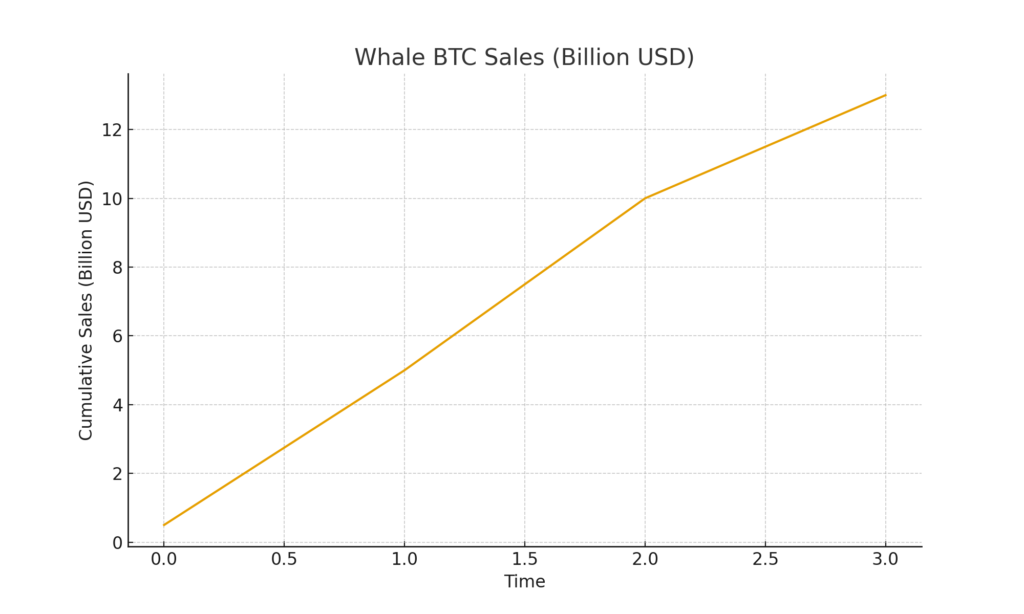
2.1 Owen Gunden: A Legendary Early Holder Exits the Market
Arkham Intelligence reported that Owen Gunden, one of the earliest Bitcoin adopters since 2011, completed the final tranche of BTC liquidation on November 21.
- Total sold since late October: $1.3 billion (~¥2,050 billion)
- Most recent transfer: $230 million worth of BTC to Kraken
- Accumulated BTC since prices were in the double-digit to triple-digit range
This selling created massive downward pressure.
Long-term holders unloading such large amounts tend to shock both retail and institutional participants.
2.2 Long-Term HODLer Supply Decline
CoinPost and other analytics platforms highlight that long-term holders have sold over $80 billion worth of BTC in the past month. While this signals short-term instability, historically it precedes strong accumulation phases.
2.3 A Clear Downward Catalyst
When a whale sells billions:
- Order book liquidity is temporarily insufficient
- Market makers widen spreads
- Algorithms detect momentum reversal
- Stop-losses cascade
- Leverage positions unwind automatically
This leads to severe volatility, as observed on November 21.
3. Forced Liquidations: The Domino Effect
According to Coinglass, the sudden BTC crash triggered:
- 223,664 traders liquidated
- Total of $8.4 billion in forced liquidations (¥1,295 billion)
- Largest single-day wipeout since Q2 2025
Liquidations are a hallmark of leverage imbalance.
In aggressive bull phases, traders tend to use high leverage; thus even a small price move can trigger massive margin calls.
Bitcoin’s liquidity structure amplifies such moves:
centralized exchanges + futures markets + perpetual swaps = unstable equilibrium under stress.
4. The Stock Market Connection: Tech Weakness Hits Bitcoin
4.1 U.S. Stock Market Declines
On the same day:
- Dow Jones: –0.84%
- S&P 500: –1.56%
- Nasdaq: –2.15%
This was partly due to fading enthusiasm after Nvidia’s blowout earnings report the previous day.
4.2 Nvidia’s Reversal and Correlation with BTC
Nvidia:
- Rose 5% post-earnings
- Fell 3% the following day
Crypto analytics firms note that traders heavily exposed to AI stocks often hold substantial BTC and altcoins. When tech corrects, crypto tends to follow.
Correlation points:
- Risk-on assets sold together
- AI + crypto investors overlap
- Macro tightening affects both sectors simultaneously
This correlation has strengthened throughout 2025.
5. Recent Market Trends: Beyond the Headlines
To provide deeper context, here are additional movements from reliable crypto and macro sources as of late 2025:
5.1 Liquidity Scarcity in Global Markets
Rising U.S. yields have:
- Pulled global liquidity out of risk assets
- Boosted the dollar
- Reduced stablecoin minting growth
Stablecoin supply growth, a key indicator of crypto health, has slowed to the lowest pace since 2022.
5.2 ETF Inflows Stagnating
Bitcoin ETFs—which helped push BTC beyond $100k earlier this year—are seeing declining inflows.
Recent 7-day trend:
- Inflows: –$620 million net
- Trading volumes down 18% week-on-week
5.3 China Liquidity Tightening
China’s real-estate-driven liquidity issues affect Asia’s risk markets, indirectly spilling over into crypto.
5.4 Mideast Geopolitical Tension
Although not directly tied to BTC, geopolitical tension raises global uncertainty—another reason traders reduce risk positions.
6. Investor Outlook: What Comes Next?
Despite sharp short-term volatility, structural fundamentals for Bitcoin remain sound:
- Hash rate remains near all-time highs
- Long-term holder supply still dominates more than 70% of circulating supply
- Institutional custodians continue expanding
- U.S. regulatory clarity is improving
- Stablecoin settlement volumes remain enormous
Historically, similar large corrections have been followed by major accumulation periods.
Possible Scenarios Ahead
Scenario 1: Continued Volatility (Short Term)
Until the Fed’s December decision, uncertainty remains. BTC may oscillate between $85k–$95k.
Scenario 2: Relief Rally (Medium Term)
If:
- VIX cools
- Rate cut probability stabilizes
- ETF inflows return
…BTC could reclaim $100k levels.
Scenario 3: Structural Bull Phase (Long Term)
Post-halving cycles and institutional adoption suggest multi-year bullish potential remains intact.
Conclusion: A Healthy Reset, Not a Collapse
Bitcoin’s drop to $86,155 is not a structural failure—it is a market correction triggered by a combination of:
- Macro uncertainty
- Whale selling
- Stock market weakness
- Liquidity tightening
- Leverage cleanup
For investors seeking new crypto opportunities and practical blockchain applications, this period represents:
- A moment to reassess fundamentals
- Potentially attractive entry zones
- A time to watch institutional flows closely
Bitcoin’s long-term trajectory remains strongly upward, even if the path includes volatility like we see now.