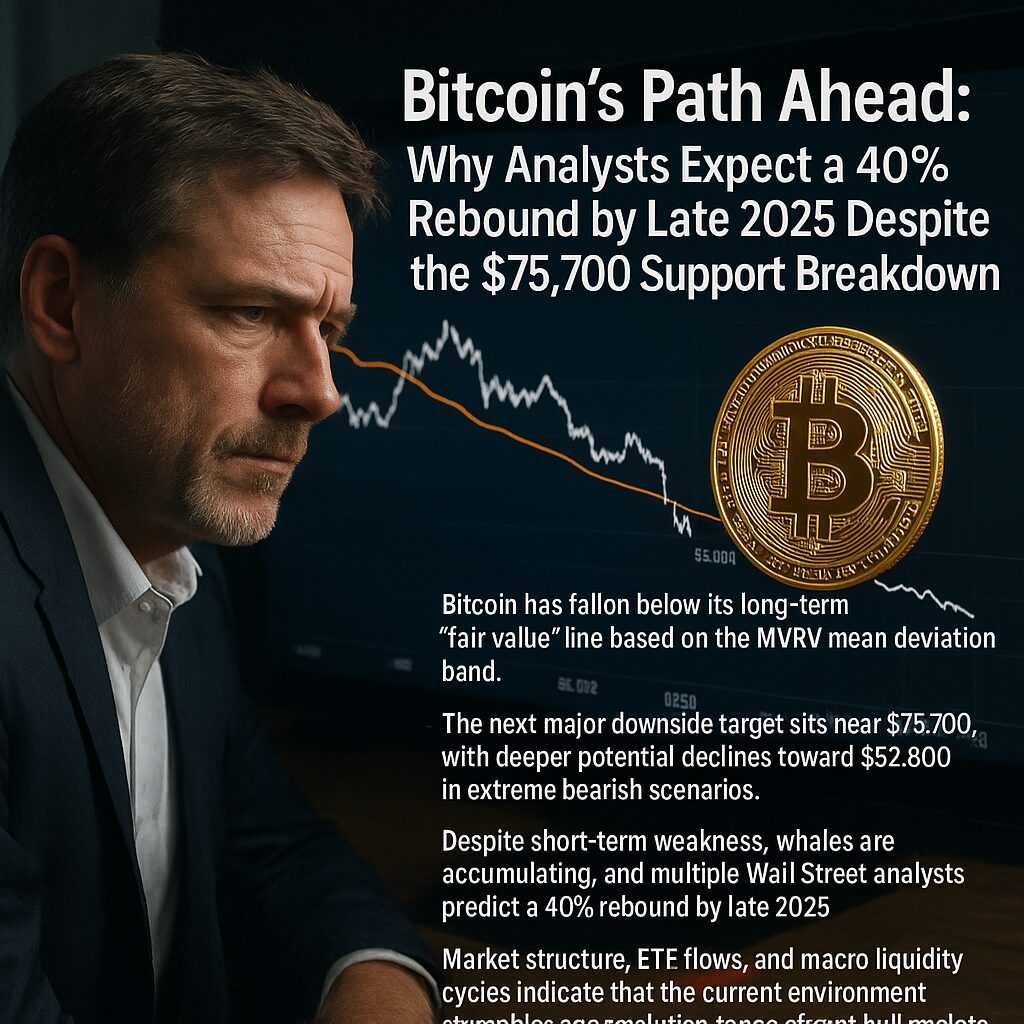
Main Takeaways :
- Bitcoin has fallen below its long-term “fair value” line based on the MVRV mean deviation band.
- The next major downside target sits near $75,700, with deeper potential declines toward $52,800 in extreme bearish scenarios.
- Despite short-term weakness, whales are accumulating, and multiple Wall Street analysts predict a 40% rebound by late 2025.
- Market structure, ETF flows, and macro liquidity cycles indicate that the current environment resembles accumulation zones of past bull markets rather than the start of a severe multi-year bear cycle.
1. Introduction — A Critical Moment for Bitcoin Investors
Bitcoin has entered one of its most fascinating and controversial phases since the bull market began in 2023. After reaching a historic all-time high near $126,300, BTC has now pulled back over 30%, breaking below a significant on-chain valuation level that has historically acted as the market’s “fair value.”
For sophisticated investors, institutional traders, and readers exploring new crypto assets or revenue opportunities, this moment is not simply a price decline—it is a strategic inflection point. Understanding why the market is weakening in the short term, yet strengthening in the long term, is essential for allocating capital efficiently throughout 2025 and beyond.
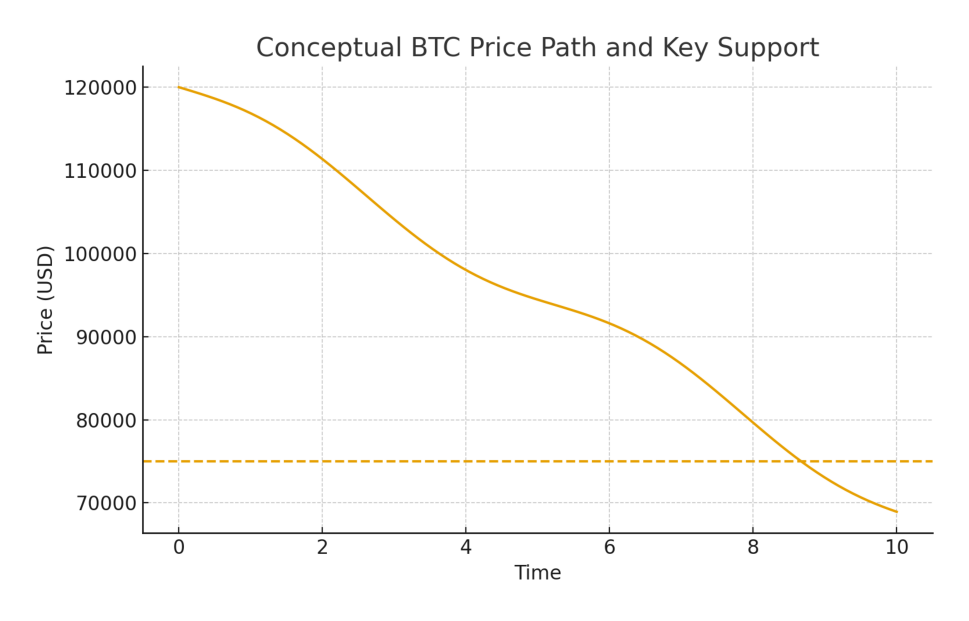
2. The Current Breakdown: Why $75,700 Is Now the Next Key Support Level
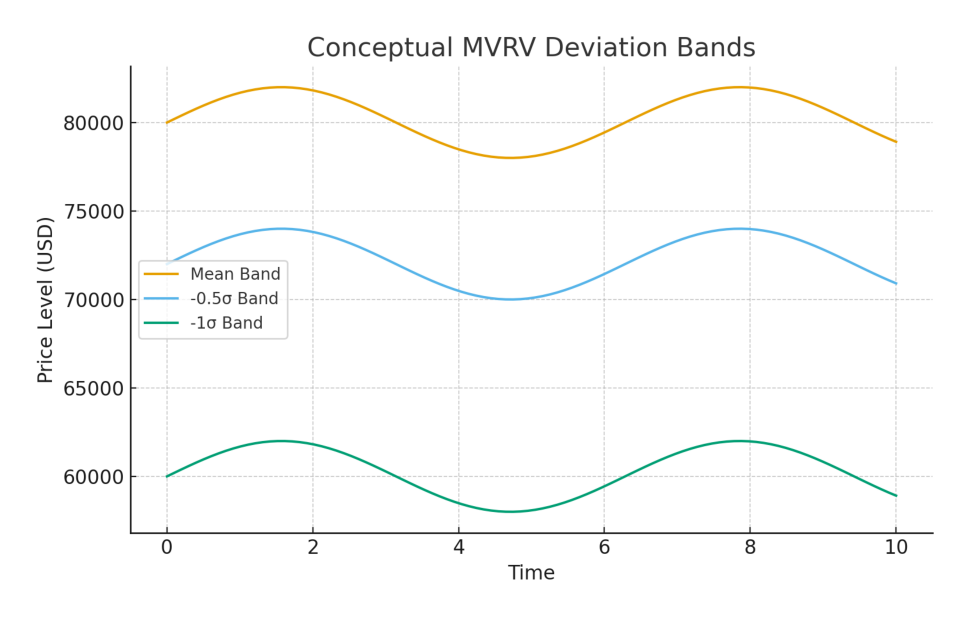
Understanding the MVRV Extreme Deviation Bands
MVRV (Market Value to Realized Value) is a core analytical metric used by institutional investors. It compares current BTC price with the average cost basis of all holders.
- Mean Band (Yellow): Represents “fair value.”
- −0.5σ Band (Teal): Typical correction depth after mean-line breakdowns.
- −1σ Band (Blue): Deep-bear capitulation levels.
For the first time since late 2022, Bitcoin has fallen below the mean band. Historically, this event has reliably triggered downward price momentum toward the −0.5σ level.
The $75,700 Target
As of this analysis, the −0.5σ band aligns with ~$75,700, marking an 18% decline from the current trading zone.
In previous cycles (2018, 2021, 2022), BTC repeatedly followed this path after losing the mean band—indicating behavioral consistency across market structure.
Risk of Deeper Decline to $52,800
If BTC also breaks below −0.5σ, momentum selling historically increases dramatically.
This opens a path toward the −1σ band at ~$52,800, representing a worst-case scenario, though not the base case for 2025 according to many analysts.
3. Why This Drawdown Is Not the Start of a Multi-Year Bear Market
A. BTC Whales Are Accumulating at The Fastest Rate in 2025
On-chain data shows that wallets holding >1,000 BTC have accumulated more than three consecutive weeks despite the pullback.
This is consistent with:
- long-term belief in future highs
- strategic buying during value zones
- redistribution from weak hands to strong hands
Historically, such whale accumulation preceded major rallies in:
- early 2019
- late 2020
- early 2023
B. ETF Investors Are Now at a Loss — a Historically Bullish Setup
Spot Bitcoin ETF holders are now negative on average for the first time.
Institutional inflows often surge when:
- public sentiment is fearful
- ETFs trade below cost basis
- liquidity conditions are improving
C. Macroeconomic Liquidity Cycles Support a Late-2025 Rally
Global liquidity indicators—such as M2 expansion, U.S. rate-cut expectations, and sovereign bond yield compression—suggest accommodative monetary conditions forming during mid-to-late 2025.
Historically, Bitcoin performs strongly during such phases.
4. Analysts Expect a 40% Rebound by Late 2025
Despite the short-term breakdown, major analysts project a sharp recovery.
Matt Hougan (Bitwise CIO)
Hougan describes the current pullback as
“one of the best long-term buying opportunities left in this cycle.”
Tom Lee (Fundstrat)
Lee forecasts BTC returning to or above ATH by year-end, implying a minimum +40% rebound from current levels.
Their thesis is based on:
- structural ETF demand
- aggressive whale accumulation
- tightening BTC supply growth post-halving
- improving risk-asset liquidity
These arguments are consistent with late-cycle consolidation phases before strong uptrends.
5. Comparing Now to Previous Market Cycles
Bitcoin’s price behavior often follows recognizable patterns:
2017–2018 Cycle
- Mean-line breakdown → −0.5σ → new highs after consolidation
- Whales accumulated after 30–40% drawdowns
2020–2021 Cycle
- Multiple pullbacks to the −0.5σ band
- Each correction preceded an explosive upside continuation
2023–2025 Cycle
Current behavior matches these historical patterns:
- Mean-line breakdown
- Whale accumulation
- Structural growth in institutional participation
This increases confidence in the late-2025 rebound thesis.
6. Opportunities for Investors Seeking New Crypto Assets and Revenue Streams
For investors interested in new digital assets or blockchain applications, the present market environment offers unique advantages:
A. Valuation Reset
Corrections in Bitcoin typically create:
- market-wide price resets
- opportunities in altcoins with strong fundamentals
- early entry points before capital rotates from BTC to new sectors
B. On-Chain Metrics Favor Accumulation
Indicators such as:
- MVRV
- RHODL
- Realized price
- Long-term holder supply
all point toward conditions similar to previous expansion phases.
C. Institutional-Grade Assets Are Now Discounted
Assets aligned with:
- payment infrastructure
- real-world asset tokenization (RWA)
- cross-chain liquidity
- decentralized identity
- stablecoin settlement networks
are receiving increased institutional interest and may outperform into 2026.
For readers exploring new crypto assets, revenue models, and practical blockchain utilities, this macro-phase is one of the most favorable since 2020.
7. Risk Management — What Investors Should Watch
Key Risk Indicators
- Loss of $75,700 support
- ETF outflows sustained for multiple weeks
- Macro tightening (unexpected rate increases)
- Declining stablecoin inflows
Key Bullish Indicators
- Whale accumulation continues
- ETF inflows resume
- BTC recovers the MVRV mean band
- Global M2 liquidity rises
Maintaining a balanced view is critical for strategic allocation.
8. Conclusion — Why 2025 Remains a Strong Opportunity Window
Even though Bitcoin is currently experiencing a technical breakdown and could reach $75,700 or even $52,800 under extreme conditions, long-term market structure continues to favor bullish outcomes.
- Whales are accumulating.
- Institutional ETFs remain structurally strong.
- Macro liquidity conditions are turning favorable.
- Analysts expect a ~40% rebound by late 2025, potentially retesting ATH.
For investors seeking new opportunities in crypto assets, yield generation, or real-world blockchain applications, the present moment resembles past accumulation phases before major rallies.
Bottom line:
Short-term fear is creating long-term opportunity, and understanding these dynamics will allow investors to position themselves effectively for the next expansion phase.