Main Points :
- Bitcoin (BTC) has broken below the psychological $100,000 support and faces key resistance near its 20-day EMA and prior breakdown level.
- Ethereum (ETH) has broken the lower boundary of a descending channel, suggesting bearish control; the next key inflection is whether it can reclaim the channel or collapse toward ~$2,500.
- XRP has lost support around ~$2.19 and must clear the near-term 20-day EMA (~$2.46) to shift momentum; below ~$1.61 the down-move could accelerate.
- Solana (SOL) dropped below ~$155 but is attempting recapture; it must clear its 20-day EMA (~$184) to regain upside, else risk falling to ~$126.
- The broader market context: institutional flows, ETF dynamics, leverage-driven liquidations and Bitcoin dominance trends are shaping whether altcoins might rotate into strength.
- For new-asset seekers and blockchain practitioners: the current regime emphasizes risk management, but also offers setup opportunities where structural narratives (DeFi, staking, infrastructure) meet technical dislocations.
1. Bitcoin: $100K Line Break & Resistance Ahead
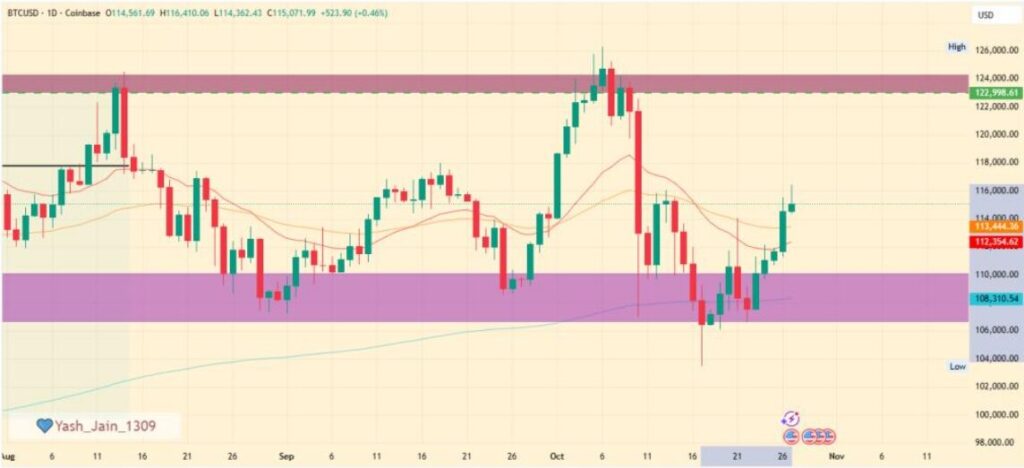
The flagship crypto, Bitcoin, recently closed below the key support level of $100,000, representing a failure of a major psychological and technical floor. Recent commentary notes that Bitcoin is now approaching a nearby resistance zone around $102,000, after the drop from $99,000 triggered renewed concern.
According to chart data, the 20-day exponential moving average (EMA) sits near $102,000–$103,000, acting as short-term resistance. A rebound that fails to clear this level could lead to renewed weakness, with one scenario pointing toward ~$98,295 or lower.
On the upside, if Bitcoin can reclaim $102K and surpass its 20-day EMA with conviction, the next target zone near the 50-day simple moving average (SMA) around ~$113K becomes relevant (per prior analysis). But if resistance holds and sellers re-activate, there is risk of a deeper correction.
For investors hunting new assets or yield opportunities: Bitcoin’s current status signals that the “safe harbour” narrative is under challenge; until we see structure break to the upside, alternative chains may offer higher relative reward (albeit higher risk).
2. Ethereum: Descending Channel Breach + Accumulation Signals
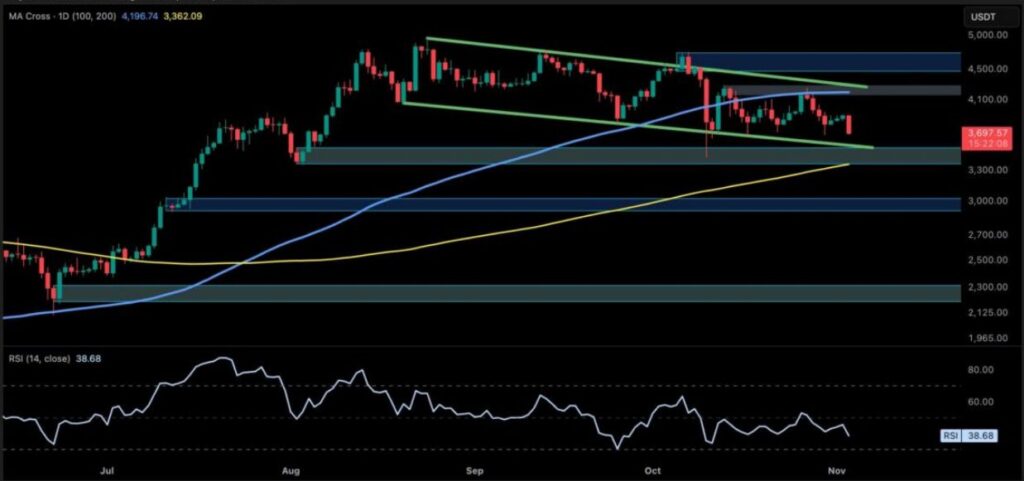
Ethereum’s technical picture is grimmer: ETH broke below the support line of a descending channel, indicating that bears have gained the upper hand. The token slid to around $3,303, a steep drop of about 16 % in 48 hours, representing the sharpest two-day drop for 2025.
Despite the drop, on-chain metrics show signs of accumulation: the Spent Output Profit Ratio (SOPR) for Ethereum dropped below 1.0 (to about 0.97) — historically a bottoming signal when weak-hand capitulation occurs.
Key thresholds:
- Resistance: 200-day EMA at around $3,601.
- Support zone: If ETH closes below ~$3,175 (50 % Fibonacci retracement), the next meaningful support could be in the ~$2,650–$2,760 range.
In practical terms for developers or blockchain strategists: Ethereum’s breakdown signals a possible “reset” phase. While fundamentals (DeFi activity, institutional interest) still matter, the chart suggests one must wait for a credible reversal (e.g., reclaiming channel) before positioning aggressively.
3. XRP: Support Lost, Must Reclaim 20-day EMA (~$2.46)
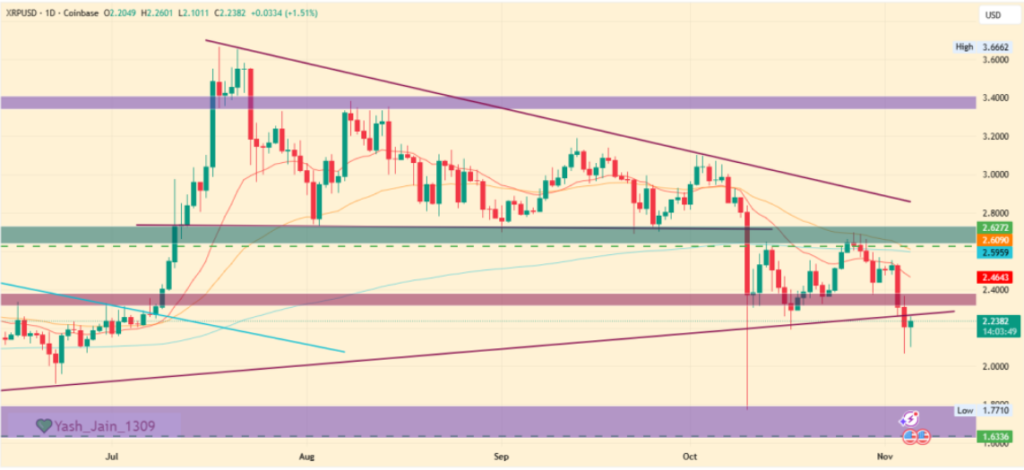
XRP has been showing increasing signs of stress: it fell below the $2.19 support level, marking that the bears are in control. On the rebound side, XRP would need to clear its 20-day EMA near $2.46 to shift back toward a “buy-the-dip” narrative. Failure to do so could expose the pair to a drop toward the next important support at $1.61, and if that breaks, potentially toward ~$1.25.
On the flip side, if XRP closes above the descending trend-line (and above ~$2.69 per the same analysis) then a trend reversal becomes plausible.
For someone exploring new crypto assets: XRP may be interesting if one believes in its payment-chain use-case and legal settlement tailwinds. But based on the chart, the risk/reward is skewed toward caution until a breakout is confirmed.
4. Solana: Infrastructure Momentum vs Technical Breakdown
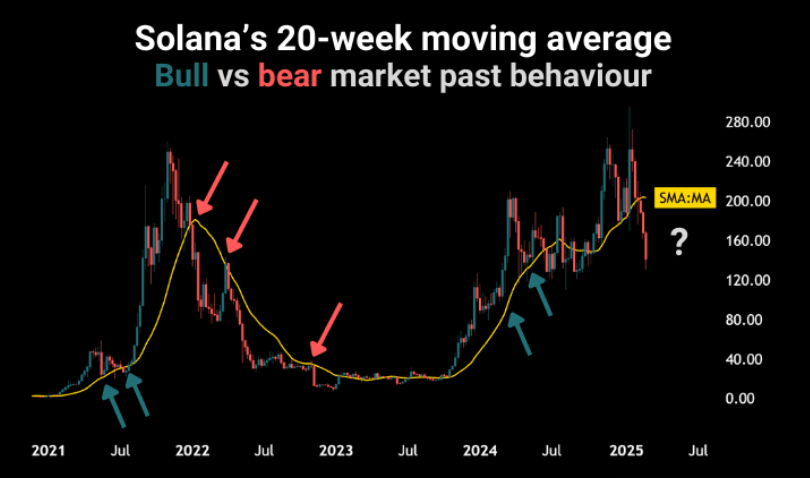
Solana is presenting perhaps the most interesting setup among the four. It recently dropped under $155 but is attempting a recapture. According to technical metrics, SOL broke below a key Fibonacci support (~$166.13) and its RSI14 is around 29 (oversold), which may hint at exhaustion.
Key numbers from the recent analysis:
- Support to watch: 20-day EMA near $197 in earlier analysis.
- Upside target if momentum resumes: ~$238 → ~$260.
- Downside risk: If SOL fails to hold the EMA/resistance zone, it may fall back toward ~$180 or lower.
From a practical standpoint: Solana’s infrastructure story (high-throughput chain, staking, growing ecosystem) remains compelling. If the technicals turn, this could be a prime candidate for next-phase growth. But the chart warns of being trapped in a channel unless a breakout occurs. For developers and ecosystem builders, monitoring SOL’s staking flows, validator metrics, and ETF dynamics may provide early directional clues.
5. Broader Market & Altcoin Rotation Context
It’s not just individual charts that matter. The overall crypto market context is shaping the environment for these assets:
- Institutional flows: For example, ETH-related ETFs had outflows (~$219 million) over a recent day, signaling waning short-term interest.
- Leverage and liquidation risk: The downturn has been driven in part by excessive leverage, with long liquidations topping $484.8 million for ETH and over $1.7 billion market-wide in a given 24-hour window.
- Bitcoin dominance: A trend of declining BTC dominance historically precedes “altcoin seasons” when capital rotates into non-BTC assets. There are signs that this may be setting up, albeit not yet confirmed.
For those seeking new crypto assets or next-gen revenue streams, these themes suggest two strategic ideas:
- Rotation opportunity – If Bitcoin stalls and dominance falls, altcoins with strong fundamentals and favorable setups (like SOL, possibly XRP) may outperform.
- Structural signals matter – Beyond chart patterns, keep an eye on staking growth, DeFi TVL, ETF approvals, on-chain metric bottoms (e.g., SOPR), and macro context (inflation,rate-cuts). These add practical weight to speculative theses.
6. Practical Takeaways for Asset Seekers & Blockchain Practitioners
- Don’t rely solely on charts; blend technical levels with fundamental/contextual signals (staking flows, ecosystem growth, institutional interest).
- Risk management is key: given the breakdowns seen, aggressive positions may be premature until clear breakout confirmations (e.g., reclaiming EMA/resistance zones).
- For new asset exploration: consider chains or tokens with structural advantages, not just price momentum. For example, Solana’s infrastructure strength, or XRP’s payment-chain angle (if risk is acceptable).
- For wallet/app developers (such as your work on “dzilla Wallet”): this environment means users may seek features like easy swapping, cross-chain access, staking/earn options, and transparency around ecosystem growth (e.g., which chains are gaining momentum).
- On the ICO/presale front: if altcoin rotation becomes real, capital may look beyond the top-4 coins into smaller ecosystems; structural narratives become more important than pure hype.
Conclusion
In summary, Bitcoin, Ethereum, XRP and Solana are at critical technical junctures. Bitcoin’s loss of the $100,000 floor raises caution. Ethereum’s channel breakdown and yet signs of accumulation highlight a deeper reset. XRP demands a reclaim of the 20-day EMA to shift momentum. Solana, among the most structurally interesting, remains in a wait-and-see mode until it breaks out of its channel. For readers hunting new crypto assets or practical blockchain applications, this phase is less about chasing the rise and more about positioning for the next wave — aligning technical setup, ecosystem strength and macro/structural tailwinds. If alt-season rotates in, those positioning early in the right projects may gain outsized rewards. Until then, capital preservation and strategic monitoring of the interplay between chart levels and on-chain fundamentals may pay off.


