Main Points :
- The market may be setting up for a broader “dip-buy” opportunity as major cryptocurrencies test key support levels.
- Bitcoin (BTC) has broken below its 20-day EMA and a support around $107,000, raising the risk of further decline to the $100,000 psychological level.
- Ethereum (ETH) has broken down from a descending channel and shows bearish signals (downward moving averages, RSI < 37), with support zones around $3,435-$3,350.
- XRP (Ripple) faces pressure below its 20-day EMA (~$2.52), with risk of falling to $2.20 or even $2.00/$1.80 absent a reversal.
- Solana (SOL) has broken its ascending-triangle support and may drop toward $155 or even $137 unless bulls intervene.
- For investors seeking new crypto assets, these technical levels suggest either risk of further downside or potential entry points if the “buy-the-dip” narrative holds.
- Practically for blockchain use-cases or altcoin hunts, the confirmation of trend reversal (moving above key EMAs/resistances) may be more important than simply buying now.
1. Bitcoin: Testing the Waters for a Dip-Buy Opportunity
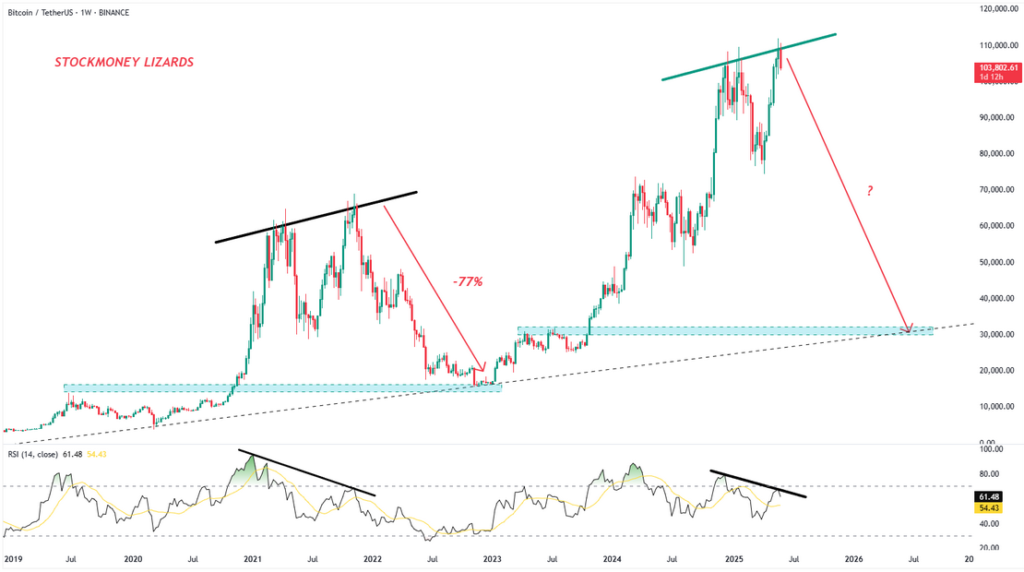
In the case of Bitcoin, the article reports that BTC dropped below its 20-day exponential moving average (EMA) of $108,837 and subsequently broke through the support around $107,000. This breakdown completes a double-top pattern, signaling a potential shift into a corrective phase. If the price closes below $100,000—a key psychological level—it would be interpreted as a sign that sellers are gaining control and a new downtrend may be starting.
From a strategic standpoint, this means that while some investors may view this as a buying opportunity (i.e., “buying the dip”), there is still significant risk if bulls cannot reclaim the EMA or drive price above $118,000. Those levels serve as thresholds for a “trend reversal” rather than purely a bounce.
In other words: if Bitcoin can push back above $118,000, it may rekindle upward momentum. But if not, the loss of the $100,000 floor might open the door to further downside.
2. Ethereum: Breakdown from Channel, Bearish Signals in Play
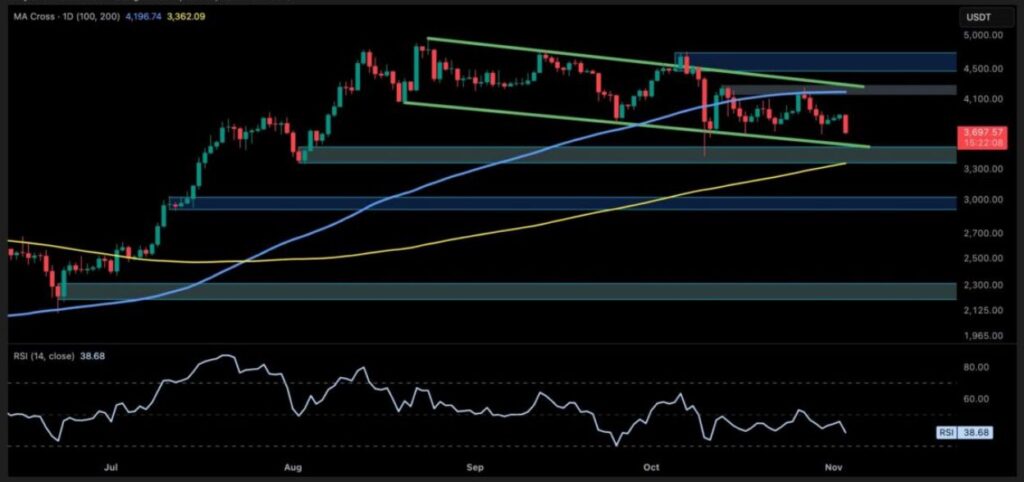
Ethereum is showing more vulnerable technicals. According to the article, ETH fell from its 20-day EMA (~$3,937) and broke the support line of a descending channel. The downward sloping moving averages and an RSI below 37 indicate that the bears have the upper hand for now.
The next likely support zone is around $3,435-$3,350. Should price rebound and reclaim the 20-day EMA, that bearish scenario could be invalidated: a bounce and move above the channel would point to bulls regaining control.
For someone looking at Ethereum either as a primary asset or a gateway into DeFi/altcoins, this suggests caution: either wait for signs of strength (moving above the channel/EMA) or accept the risk of further downside and plan accordingly.
3. XRP (Ripple): Risk of Further Drop Unless Reversal Occurs
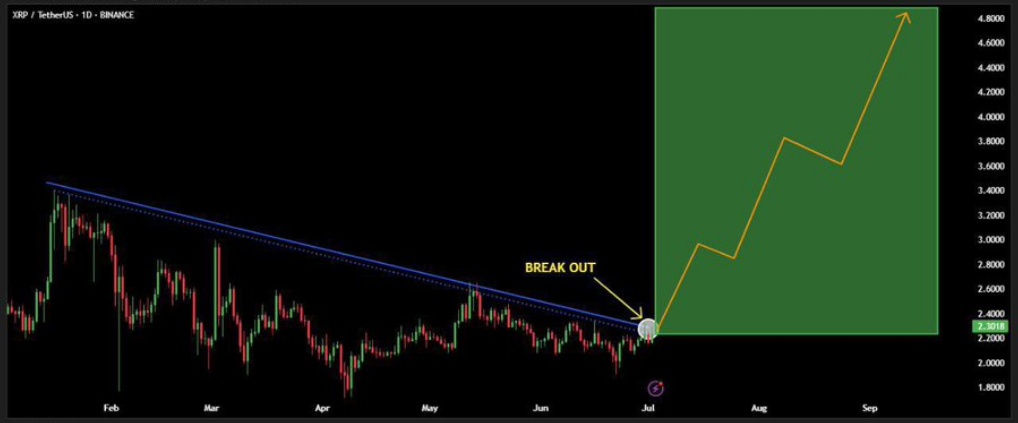
In the case of XRP, the article describes how buyers attempted to push the price above the 20-day EMA (~$2.52) but the sellers held firm. The key short-term support to watch is $2.20. If that level breaks, the pathway opens toward $2.00 and possibly $1.80.
Even if a rebound occurs, the 20-day EMA and 50-day simple-moving average (SMA) at ~ $2.69 are likely resistance zones where selling pressure could emerge. The critical reversal signal would be a move above the descending trend line, which would point toward a trend change rather than just a bounce within a downtrend.
From a practical standpoint, for investors seeking new crypto assets: XRP may have upside if support holds and reversal begins, but current risk is elevated. The prudential view is to wait for bullish confirmation rather than entering aggressively.
4. Solana: Triangle Breakdown – Lower Levels on the Table
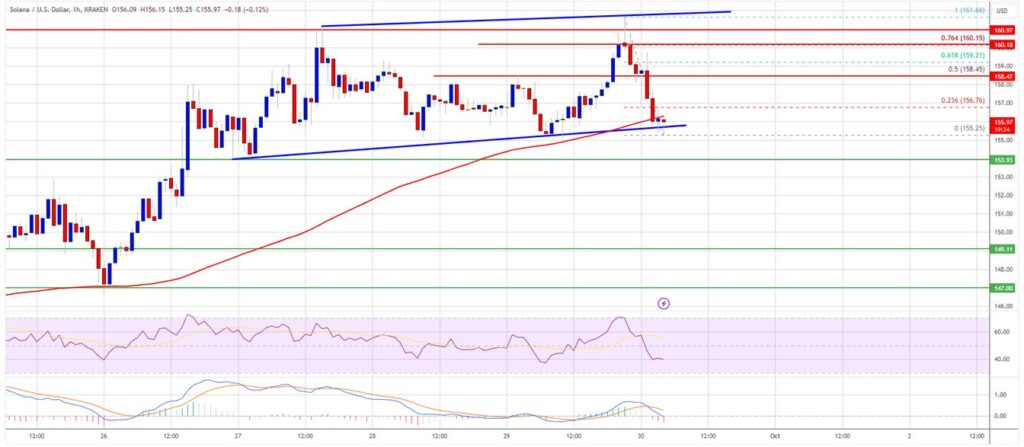
Solana’s technical picture is similar to the others, though it appears more acute. The article states that SOL broke below the ascending‐trendline of a symmetrical triangle—a pattern that often signals consolidation resolving in favour of the bears. The next strong support level is $155 and, if that fails, the price could drop toward $137.
Conversely if SOL rebounds from current levels (or around $155) and pushes above the 20-day EMA (~$190), it would suggest demand at lower levels and potentially a return of bullish momentum. For those investigating altcoins with practical blockchain application (e.g., Solana ecosystem plays), this is a double‐edged scenario: a possible entry at support, but greater risk if the breakdown continues.
5. Strategy for New Asset Hunters & Blockchain Practitioners
Putting the above together, what does this mean for your audience of new crypto-asset seekers, income-opportunity hunters, and blockchain application practitioners?
5.1 Entry Timing vs Trend Confirmation
If you are looking for the next asset to accumulate, these charts suggest there are potential “dip” zones—but the key question is: are you catching a bounce or a trend reversal? Waiting for a move above key resistances (EMAs, channel/triangle breakouts) offers more confidence of trend change. Entering too early might mean riding a further downside.
5.2 Risk-Adjusted Entry
Given the technical warnings (especially for ETH, XRP, SOL), conservative strategy suggests scaling in rather than full commitment. For example: allocate partial capital at current levels with stop-loss or risk ceilings in place; increase allocation when a signal confirms.
5.3 Blockchain Application & Altcoin Screen
Since your readers are also interested in practical blockchain use–cases, you might consider: instead of focusing purely on price, evaluate ecosystem metrics: network activity, developer growth, on-chain volume, protocol upgrades, token unlock schedules. A coin with strong fundamentals but vulnerable technicals may still present long-term opportunity if you believe in its use-case.
5.4 The “Buy-the-Dip” Narrative — Not Guaranteed
The article’s theme is that “dip-buying” may be spreading, but it is not guaranteed. External factors (macro environment, regulatory news, global liquidity, interest-rates) still matter. For example, one recent piece noted that crypto faced pressure from rising U.S. Treasury yields and a stronger dollar, which dampened risk-assets.
Therefore, treat current support tests as potential rather than sure entry zones.
6. Summary and Outlook
In summary, the major cryptocurrencies—Bitcoin, Ethereum, XRP, Solana—are each at or near pivotal technical junctures. For Bitcoin, the break below $107,000 and its 20-day EMA signals caution unless bulls reclaim. For Ethereum, the channel breakdown and RSI signal bears are in control for now. XRP and Solana both risk lower support levels unless reversal momentum builds.
For the audience actively hunting new crypto assets or exploring blockchain application opportunities, this environment presents both risk and opportunity. If one believes we are entering a “buy-the-dip” phase, then selectively layering positions around support zones makes sense—but prudent risk controls and waiting for reversal cues remain wise. If one leans more conservatively, waiting for momentum above key resistances may provide safer entry.
On the practical side, beyond chart-entry timing, looking at ecosystem fundamentals, developer engagement, token unlock calendar, and network metrics remain critical. A coin that clears its technical hurdles and shows real-world usage may be a superior long-term candidate.
In the end: this is not simply about buying the dip and hoping; it’s about timing, risk-management, and fundamental conviction in the underlying blockchain asset.


