Main Points :
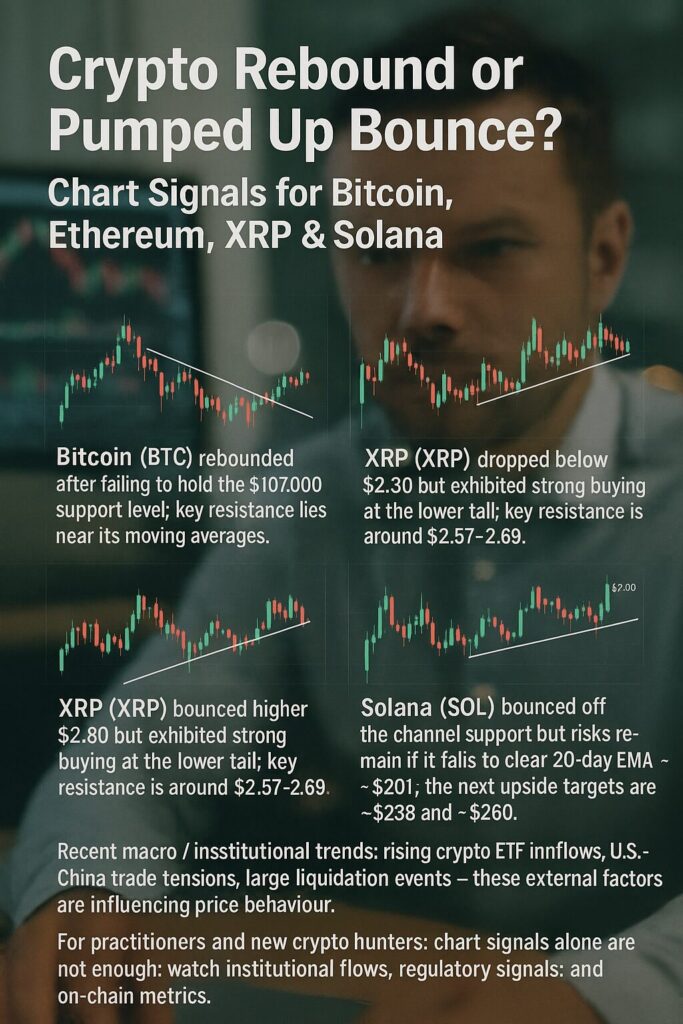
- Bitcoin (BTC) rebounded after failing to hold the $107,000 support level; key resistance lies near its moving averages.
- Ethereum (ETH) pushed higher from its support line inside a descending channel, but sellers loom near its moving average.
- XRP (XRP) dropped below $2.30 but exhibited strong buying at the lower tail; key resistance is around $2.57–$2.69.
- Solana (SOL) bounced off the channel support but risks remain if it fails to clear the 20-day EMA ~ $201; the next upside targets are ~$238 and ~$260.
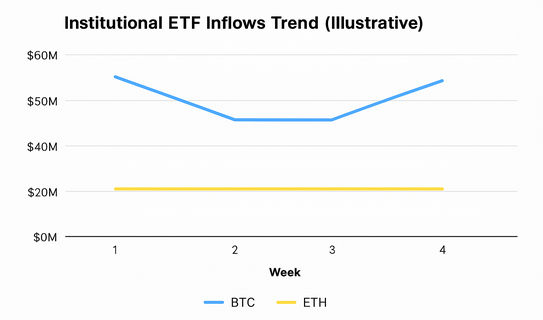
- Recent macro / institutional trends: rising crypto ETF inflows, U.S.-China trade tensions, large liquidation events — these external factors are influencing price behaviour.
- For practitioners and new crypto hunters: chart signals alone are not enough; watch institutional flows, regulatory signals, and on-chain metrics.
1. Bitcoin’s Bounce and Resistance Battle
After a slide below the $107,000 mark, Bitcoin buyers stepped in and drove the price up. The original article pointed out that if buyers push past the moving average region, it could signal the end of the current correction. Conversely, if sellers force a fall below the $107,000 support, the risk of a drop toward $100,000 increases.
When we step back and look at recent data, it confirms this narrative: as of October 20 2025, Bitcoin is trading around $110,900. Technical analysis from Investopedia notes that major support near the 200-day moving average is holding, but momentum indicators remain mixed.
In practical terms: for someone exploring crypto as a next income stream or as part of blockchain-based business planning, Bitcoin’s motion here suggests two scenarios:
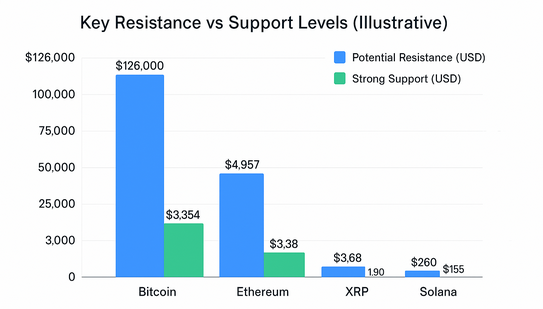
- Bull case: Bitcoin clears the major moving average resistance, signaling broad strength and potentially opening the path back toward the previous all-time high around ~$126,000 (as the article suggests).
- Bear case: If support fails near ~$107,000, a revisit to ~$100,000 or lower is plausible.
Given the size and institutionalisation of Bitcoin, this is less “high-risk speculation” and more “platform asset” behaviour — but the volatility remains.
2. Ethereum: Channel Break or Renewed Downtrend?
The original article noted that Ethereum rebounded from its support line in a descending channel, and if buyers can break the channel’s upper resistance (around ~$4,957 as cited) then a new up-trend may begin; failure could lead to a fall toward $3,354.
Looking at recent market data: Ethereum is trading around $4,000 (e.g., ~$4,055 according to the Economic Times) in mid-October. Another article flagged a fall toward $3,900 amid U.S.–China tensions and liquidation pressure.
From an operational/blockchain use-case perspective, Ethereum remains central to DeFi, NFTs and smart-contracts; so a breakout above channel resistance could physically reflect increased utility, not just speculation. Conversely, if it breaks down, that could signal a significant pause in the “Ethereum platform growth” narrative.
For someone scanning for new crypto-assets or blockchain-business opportunities, Ethereum’s trajectory is important: is it consolidating for another run, or stalling? A breakout could open more active ecosystem engagement (and hence business/earnings opportunities).
3. XRP: A Stand-out Bounce with Key Resistance
XRP’s chart behaviour caught attention in the article: after dipping below $2.30, a long lower wick indicated strong buying at the lower levels. The article identified the resistance zone between ~$2.57 (20-day EMA) and ~$2.69; a close above ~$2.69 could shift control to buyers and open the path to ~$3.20 and ~$3.38. Conversely, failure would leave a drop toward ~$1.90 on the table.
In the broader context: XRP is in the midst of renewed speculation about a spot ETF, institutional flows and regulatory clarity (see e.g., recent article speculating on a $6 target if ETF approvals come). For blockchain usage: although XRP Ledger has use-cases in remittances and tokenisation, its business narrative often depends on regulatory outcomes and institutional adoption, not purely on tech adoption.
Thus for investors/business-builders: if XRP breaks key resistance, it may mark a shift from speculation toward “institution-driven” crypto. If not, it might remain in limbo and be riskier than the platform coins in my list.
4. Solana: High Throughput Platform, or Chart Under Pressure?
The article noted that Solana rebounded off the lower support of its descending channel, signalling demand at lower levels. However, the 20-day EMA (~$201) is a hurdle. If price fails there and falls below the support, the risk of a drop to ~$155 exists. If price breaks upward, targets of ~$238 and ~$260 are plausible.
From the blockchain perspective: Solana is a high-throughput smart-contract / dApp platform that competes with Ethereum. For people looking for “next business model” in blockchain, Solana remains interesting. However, the chart signal suggests caution: operational potential is high, but price and investor sentiment may be fragile.
Given the current trading around ~$189 (CoinGecko ~ $189 for SOL) as of today. If platform usage increases (dApps, DeFi, institutional projects), a breakout could be meaningful. If not, it remains vulnerable.
5. Macro / Institutional & Market-Flow Context
Beyond individual charts, the broader market context is crucial, especially for those seeking new revenue streams or blockchain business opportunities. Some recent developments:
- Record global inflows into crypto ETFs: e.g., ~$5.95 billion in the week ending October 4, 2025, including ~$3.55 billion into Bitcoin and ~$1.48 billion into Ethereum.
- Large liquidation events: over $19 billion in crypto liquidations triggered by U.S.–China trade tensions and leveraged positions.
- Bitcoin being pushed below support of ~$100,000 due to macro/regulatory concerns; yet institutional accumulation is still being cited as a positive.
For someone scanning for next income or business-model in the blockchain/crypto space, these points underline that price swings are not just technical — they reflect flows, regulation, institutional adoption, macro-economics and technology fundamentals. So chart signals must be interpreted alongside these.
6. Practical Implications for Crypto-Hunters and Blockchain Practitioners
What does this mean practically for you if you’re exploring new crypto assets, trying to build a revenue stream in blockchain, or assessing technical platforms?
- Be watchful of breakout levels. For each coin above, the breakout (or breakdown) will often trigger larger moves. For example: Bitcoin clearing its moving average, Ethereum clearing its channel, XRP breaking ~$2.69 and Solana clearing its 20-day EMA.
- Factor in institutional flows and regulatory momentum. Even a strong chart pattern can falter if flows dry up or regulation turns sour. Conversely, a modest chart breakout may succeed if institutional tailwinds are present.
- In platform-coins (Ethereum, Solana) focus also on on-chain usage, ecosystem growth and partnerships; for utility/business-use cases, that matters more than pure speculation.
- For speculation/accumulation plays (like XRP), risk/reward might be higher but so is dependency on external catalysts (ETF approvals, regulatory clarity).
- Always maintain risk-management: crypto remains highly volatile, and the studies show forecasting is inherently difficult. For example, one academic paper found that cryptocurrency time-series resemble Brownian noise and simpler forecasting models often outperform complex ones.
Summary and Outlook
In summary, the recent article’s chart analyses for Bitcoin, Ethereum, XRP and Solana remain highly relevant: each coin sits at a technical inflection point. The difference now is that macro/institutional dynamics have intensified — record ETF inflows, major macro shocks (U.S.–China trade, regulatory shifts), and large liquidations make this environment both high opportunity and high risk.
For those seeking new crypto assets or blockchain-business opportunities: the charts suggest that breakthroughs could lead to meaningful moves and thus create business or investment momentum. However, you must treat signals in coordination with flows, adoption metrics and regulatory context. The chart alone is not destiny.
If I were to give a prediction:
- Bitcoin: likely to test the moving average resistance and either clear it (bullish) or revisit $100,000 – $93,000 if support breaks.
- Ethereum: breakout from the descending channel would strengthen its platform narrative; failure could pose a sharp setback.
- XRP: stands out as a speculative turnaround candidate; a close above ~$2.69 could trigger a meaningful move toward ~$3.20 +; but downside risk remains.
- Solana: still viable for blockchain-business use-cases, but price trajectory is fractured; breakout would confirm momentum; otherwise expect consolidation or correction.
From a business/practical viewpoint:
- Use these setups as “watch zones” not guarantees.
- Integrate adoption metrics (dApp usage, TVL, token flows) for platform coins.
- Monitor institutional flow data (ETF inflows/outflows) for large caps.
- Be prepared for volatility and downstream opportunities: new tokens, platform launches, ecosystem partnerships may accelerate when breakout happens.
In conclusion: the crypto market may be setting up for its next phase of movement — whether it’s a sustained bullish surge or a deeper consolidation remains to be seen. For practitioners and investors interested in new revenue streams or blockchain applications, this is a moment to watch closely, position smartly and ensure that chart signals are bolstered by business/usage fundamentals and institutional context.