Main Points :
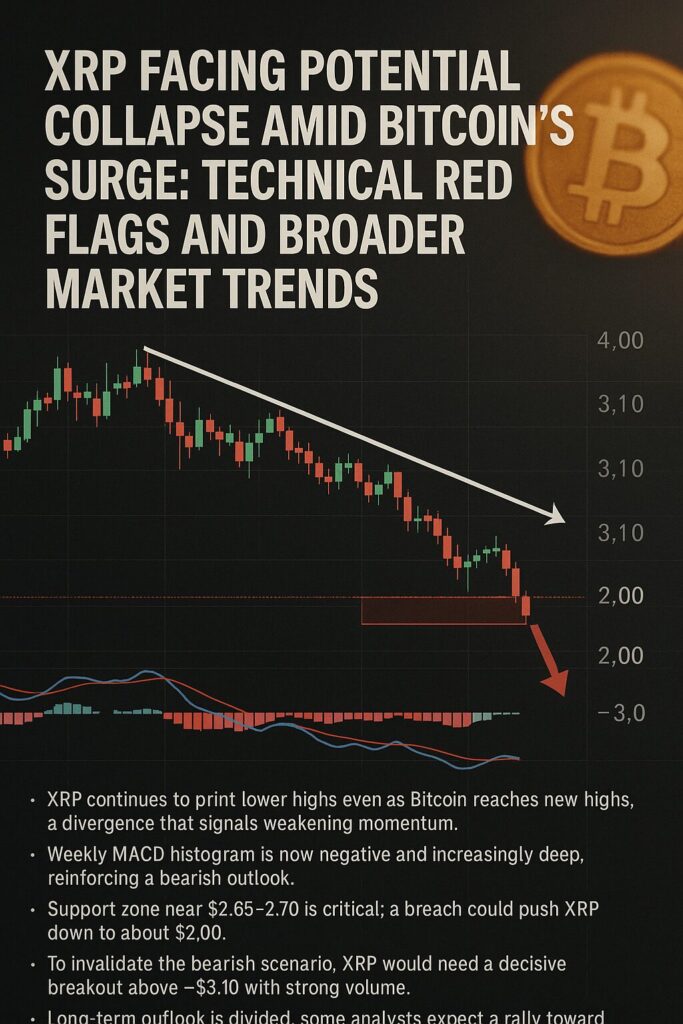
- XRP continues to print lower highs even as Bitcoin reaches new highs, a divergence that signals weakening momentum.
- Weekly MACD histogram is now negative and increasingly deep, reinforcing a bearish outlook.
- Support zone near $2.65–$2.70 is critical; a breach could push XRP down to about $2.00.
- To invalidate the bearish scenario, XRP would need a decisive breakout above ~$3.10 with strong volume.
- Recent market flows (ETF inflows, macro trends, on-chain signals) create both upside opportunity and downside risk.
- Long-term outlook is divided: some analysts expect a rally toward $5–$10, while others caution about deeper corrections.
1. Technical Breakdown: Lower Highs vs Bitcoin’s New Highs
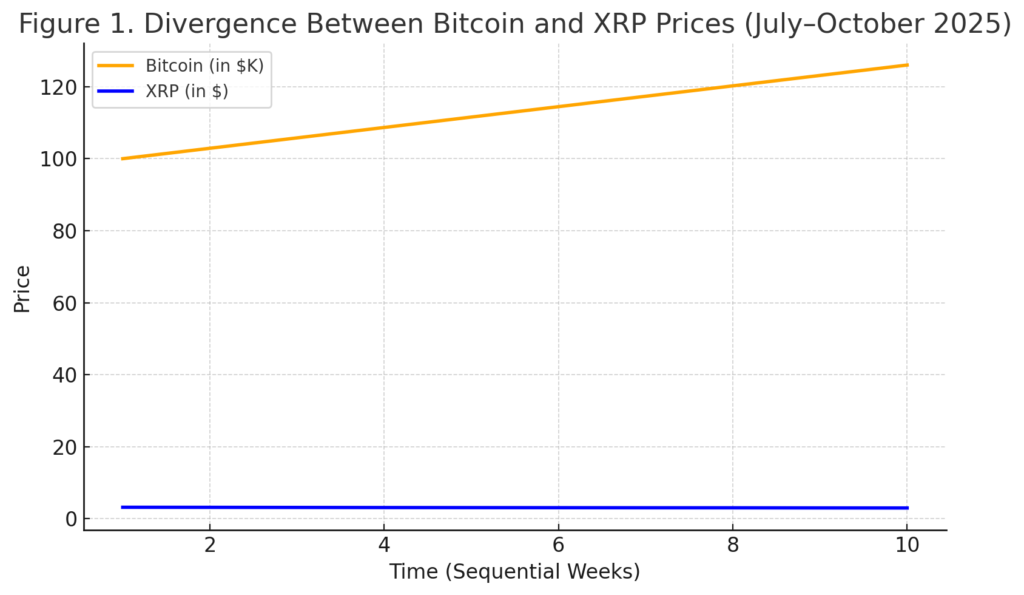
In the source article, Omkar Godbole points out a concerning pattern: while Bitcoin continues to post fresh all-time highs, XRP has consistently failed to do so. This “lower highs” pattern (where each successive peak is lower than the previous one) is a hallmark of weakening demand and diminishing bullish conviction. In normal times, many altcoins move in sympathy with Bitcoin, but when an altcoin begins lagging, it often is more vulnerable when Bitcoin pulls back. The divergence suggests that XRP’s buyers are reluctant to commit near higher levels.
Furthermore, the article notes that the repeated lower highs have formed over XRP’s horizontal support area around $2.65 to $2.70. As this support is tested more and more, its strength weakens. Were that support to collapse, XRP could experience a sharp downside move, with a target near $2.00.
2. MACD Weekly Histogram: A Deepening Bearish Signal
A key indicator in the original article is the weekly MACD histogram. After crossing below the zero line in the previous month, it continues to push deeper into negative territory, producing longer red bars. This kind of behavior signals that downward momentum is intensifying. In other words, the trend strength is tilting in favor of sellers rather than buyers.
Because the weekly timeframe carries more weight for longer-term trend decisions, this shift matters. Even if daily or intraday charts sometimes show relief bounces, the weekly MACD paints a cautious (or even bearish) longer-term picture for XRP.
3. Required Breakout Condition: Overcome $3.10
To derail the bearish scenario, XRP needs a strong, volume-backed move above the recent high of $3.10. Without that, the pattern of lower highs is likely to continue, reinforcing the downside risk. In technical analysis, breakouts above well-defined resistance zones with volume confirm a shift in sentiment. But given that XRP has repeatedly failed to breach those levels, any further attempt must show conviction (e.g. higher-than-average volume, supportive momentum indicators) to be credible.
4. Recent Market and On-Chain Trends: Mixed Signals
While the technicals lean cautious, the broader market and on-chain trends offer a mix of tailwinds and headwinds:
- ETF inflows have been robust: In the week ending October 4, global crypto ETFs drew $5.95 billion in inflows, including $219.4 million into XRP-related products.
- Macro and dollar strength: A rising U.S. dollar has put pressure on cryptos broadly, triggering profit-taking among short-term traders.
- Institutional interest and legal clarity: Optimism around regulatory clarity, including the improved legal standing of XRP, has driven some bullish sentiment and inflows.
- On-chain red flags: Despite recent rallies, XRP’s exchange reserves have seen upticks, suggesting increased selling intent.
- Whale accumulation: Some whale wallets have increased holdings, and XRP reserves on exchanges have dropped, indicating accumulation.
- Profit-taking signals: Analysts have flagged NUPL (Net Unrealized Profit/Loss) metrics suggesting that the rally may have peaked near ~$3.18.
- Notable warnings: Veteran trader Peter Brandt has predicted a ~20% drop for XRP in October, citing descending triangle structures, mid-tier selling, and sentiment risks.
Thus, while capital is flowing into crypto broadly (including XRP), internal structure and supply-side dynamics are raising caution.
5. Alternative Scenarios: Bullish Targets and Upside Case
Although the headline warns of a potential crash, many market participants remain bullish on XRP’s mid-to-long-term potential. Some of the more optimistic forecasts include:
- Resistance breakout: Analysts identify $3.60–$3.66 as a key resistance zone. Clearing it could open the path to $4.11 and even $4.65 (via Fibonacci extension) in a strong push.
- Wave structure toward $5–$10: Some trend-following analysts see a possible rally to $5 or even $10 if momentum sustains and structural breakout occurs.
- Healthy pullback scenario: After a ~19% drop from local highs, some say the pullback is constructive and could lead to another phase of upward motion.
- Short-term bounce zones: Recovery and bounce attempts have been seen around $2.96–$3.06, pushing toward $3.24 in some intraday sessions.
- ETF-driven upside: If ETF demand is strong, inflows could push XRP toward much higher levels, some even speculating ~$50 in extreme scenarios (though that would require massive capital flows and unrealistic assumptions).
In essence, while the dominant technical narrative is cautious, these upside alternatives remain valid provided market structure shifts and investor sentiment aligns.
6. Practical Implications for Crypto Hunters & Blockchain Operators
For your audience — those seeking new crypto opportunities, alternative revenue sources, or real-world blockchain applications — here are pragmatic insights:
- Trade cautiously around XRP: The current setup suggests elevated risk. Entry positions around support can make sense, but with tight stops.
- Watch volume and breakout confirmation: Given multiple failed breakout attempts, only a volume-strong move above $3.10 (or higher resistance zones) should be trusted as a trend shift.
- Consider hedged positions in correlated altcoins: Since many altcoins follow Bitcoin’s trajectory, it may be safer to diversify or pair XRP exposure with other midcaps.
- Monitor on-chain metrics: Keep tabs on exchange reserves, whale flows, NUPL, and funding rates — they often lead price moves.
- Use blockchain utility signals: For real-world projects or adoption plays, evaluate metrics like XRPL usage, transaction volume, and partnerships rather than focusing solely on price.
- Time horizon matters: Short-term caution does not preclude long-term upside, especially if fundamental catalysts (regulation, institutional adoption) continue.
7. Summary & Final Thoughts
In summary, the original article warns of a looming XRP collapse if technical support breaks and Bitcoin pulls back. It emphasizes that XRP’s pattern of lower highs amid Bitcoin’s new highs is a strong red flag, and the weakening weekly MACD histogram reinforces the bearish view.
However, offering a broader context, recent ETF inflows, improved regulatory clarity, institutional interest, and on-chain accumulation suggest that upside remains possible — though the path is narrow and contingent on structural reversals.
Thus, while XRP may be set up for increased volatility (and potential downside), it’s not a foregone conclusion that it will crash. For investors and crypto-savvy strategists, the next few weeks are critical: breakout confirmation, volume strength, and on-chain sentiment shifts will likely determine whether XRP enters a sustained bull leg or succumbs to correction pressure.
If you like, I can also produce a price forecast grid (e.g. worst case, base case, bull case), or compare XRP’s technicals with several alternative cryptos to spot relative strength. Would you like me to do that next?