Main Points :
- Bitcoin (BTC) is aiming for a breakout toward $140,000, though key support zones must hold.
- Ethereum (ETH) has signaled a potential trend reversal, with resistance around $4,957 to watch.
- XRP faces a decisive battle at its descending trendline; a bullish breakout could trigger short squeezes.
- Solana (SOL) remains in an uptrend, with $237–$260 as the next hurdles and $214 as critical support.
- Broader market and macro conditions (ETF flows, dollar strength, institutional participation) are reinforcing momentum.
- Risks include breakdowns below key moving averages and rotation into altcoins or “second-tier” assets.
- For practical blockchain/crypto adopters, on-chain metrics, project fundamentals, and institutional capital flows now matter more than ever.
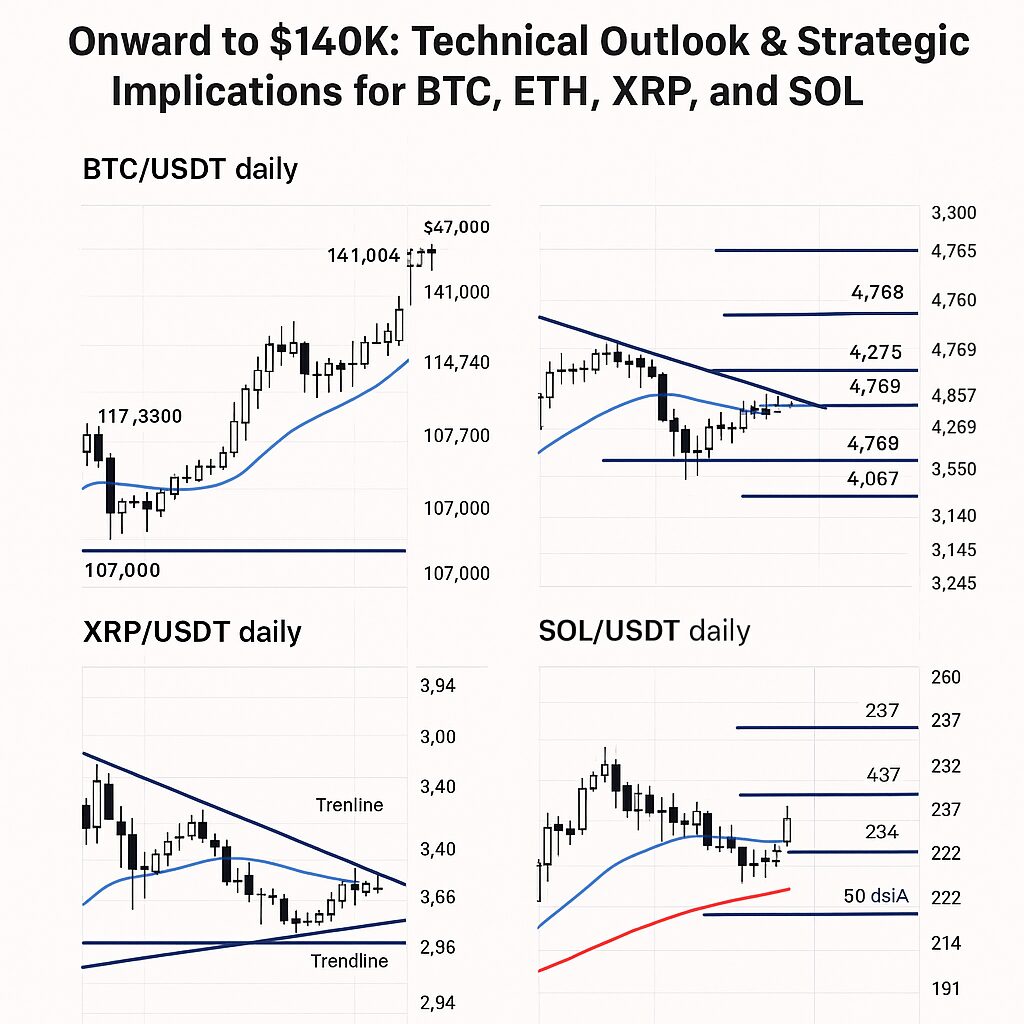
1. Bitcoin Price Outlook — Pushing Toward $140,000
In recent sessions, bearish traders attempted to initiate sell pressure during the rally up to $125,708, but bulls defended the breakout zone around $124,474. If Bitcoin fails to maintain that level, it may drift downward toward the 20-day exponential moving average (EMA), currently near $117,291. A strong rebound from that EMA could embolden bulls to push BTC toward $141,948.
Conversely, if BTC breaks below the 20-day EMA, it may consolidate in a range between $107,000 and $126,000 for a few days. A drop beneath $107,000 would complete a bearish double-top pattern, signaling deeper weakness.
Recent on-chain data give a mixed but cautiously positive signal: exchange reserves are near year-to-date lows, suggesting fewer coins are being sold. Meanwhile, recent flows into spot Bitcoin ETFs (e.g. in the U.S.) have continued to bring institutional capital into the market, pushing upward pressure.
Analysts also note that BTC has broken out of a descending channel, which supports further upside if sustained. However, given the scale of recent moves, a pullback toward $118,000 may be healthy before a further leg up.
Key levels to monitor:
- Support: $117,300 (20-day EMA), then $107,000
- Resistance / targets: $125,000–$126,000 zone, then upward toward $140,000+
If bulls maintain control above the $125K zone and sustain momentum, a test of $140,000 becomes plausible. But the scenario is not risk-free; a decisive break below the 20-day EMA would shift the tactical advantage to the bears.
2. Ethereum (ETH) — Reversal in Motion
ETH has recently cleared its resistance trendline, suggesting that the prior corrective phase may be ending. If ETH closes above that line convincingly, it could unlock further upside toward $4,769 and then $4,957. Should buyers remain aggressive beyond these hurdles, ETH could surge toward $5,500.
On the downside, if ETH fails to hold the 20-day EMA (currently ~$4,375), it could drag more aggressive bulls into stop losses. In that case, ETH may retest support between $4,060 and $3,745.
Some longer-term ETH forecasts expect a trading range between $4,539 and $5,467 during October 2025. ETH’s activity metrics, network usage, and token burn rates will also play a role in sustaining momentum.
If ETH secures a breakout above its resistance and holds it, this may mark a return of sustained bullish trend after the recent consolidation.
3. XRP — At a Crossroads
XRP continues to wrestle with its descending trendline. The 20-day EMA (around $2.94) is gradually turning upward, and the RSI has crossed slightly above midpoint, indicating a minor tilt toward bulls. If XRP breaks above and closes beyond the trendline, it could invalidate the current descending triangle and trigger a short squeeze. That could drive XRP to $3.40, and potentially $3.66.
However, if XRP instead collapses back below the moving averages, the price may linger within the triangle structure. A breakdown could lead to downside exploration until the triangle is resolved.
Some bullish forecasts suggest XRP could reach $5.00–$5.50 by end-2025 if institutional adoption intensifies.
Given its current tension, XRP may be among the more volatile names in the near term — and for traders searching for opportunities, it demands careful breakout confirmation.
4. Solana (SOL) — Uptrend Intact, Watching Key Zones
Solana’s price has been pressed lower by sellers toward the 20-day EMA (currently ~$222), but bulls have so far held the line. The upward slope of the EMA and an RSI in bullish territory favor buyers. If SOL breaches $237, the next resistance target is $260.
However, should SOL break under its 50-day simple moving average (SMA) (around $214), the bullish thesis would weaken. In that scenario, SOL could fall toward $191 as a significant support level.
The short-term weekend forecast suggests that staying above $225 may allow a push toward $240–$250. Conversely, a drop below $215–$220 could invalidate the trend.
Given Solana’s high throughput, low transaction cost infrastructure and growing institutional interest (including potential ETF inclusion) , it remains one of the top layer-1s to watch for momentum continuation.
5. Broader Trends & Market Drivers
5.1 ETF Flows & Institutional Capital
One of the strongest tailwinds for the current cycle is the inflow of capital via spot ETFs and institutional allocations. Recent weeks have seen billions of dollars directed into Bitcoin ETFs, propelling buying pressure. Moreover, “debasement trade” narratives amid fears of fiat weakness are fueling crypto demand.
5.2 Macro & Dollar Dynamics
The weakening U.S. dollar is acting as a supportive backdrop for crypto, especially in risk-on environments. At the same time, economic uncertainty and political headwinds are pushing some investors toward alternatives like crypto and gold.
5.3 Rotation & Altcoin Opportunity
Some analysts are flagging potential rotation away from BTC into select altcoins (XRP, ETH, DOT) as yields flatten or whales unwind BTC positions. If rotation accelerates, mid-caps and high-momentum tokens may become hotspots.
5.4 On-chain & Fundamentals Matter More
For those seeking sustainable yields in crypto, price alone is no longer sufficient. On-chain metrics (e.g. active addresses, network growth, token velocity), developer activity, project roadmaps, and capital backing now greatly influence risk/reward. Well-capitalized projects with real usage may outperform in periods of broader market pullbacks.
6. Strategy & Practical Implications
- Risk management is essential. Use tight stops around breakdown levels (e.g. 20-day EMA) and be prepared for range-bound action.
- Look for confirmation before jumping in. Wait for clean breakouts (close above resistance) rather than speculation.
- Watch capital flows. ETF inflows, institutional activity, and whale movements will often lead price rather than lag.
- Balance between momentum and fundamentals. In altcoins especially, prioritize projects with strong use cases and healthy metrics.
- Be tactical with position sizing. Given volatility, layer entries rather than going all in.
- Use cross-asset signals. Dollar, gold, equity markets, bond yields — watch correlations and divergences for clues.
Conclusion
The technical setup for Bitcoin, Ethereum, XRP, and Solana today presents both opportunity and risk. Bitcoin’s rebound toward a possible $140,000 target hinges on holding support above its 20-day EMA. Ethereum’s breakout attempt may mark the end of its correction phase, provided it can sustain above resistances. XRP is in a high-stakes battle at its descending trendline; a breakout could trigger explosive moves. Solana remains structurally bullish, with defined zones for continuation or breakdown.
At the macro level, strong ETF flows, weakening fiat currencies, and institutional interest are reinforcing upward pressure. But the market is not without danger: breakdowns beneath key averages or rotations away from large-caps could unsettle the rally.
For readers seeking new crypto opportunities and real-world blockchain use cases, this is a moment to balance technical awareness with fundamental depth. Those who combine tactical execution with project insight may find the best prospects in the coming weeks.


