Key Takeaways :
- Bitcoin closed September with a ~4.5% gain, a rare “green September,” which historically has preceded strong Q4 performance.
- Previous years when September ended positively (2015, 2016, 2023, 2024) saw average Q4 returns above 50%, with October often driving the largest gains.
- On-chain signals (Spot Taker CVD turning positive, rising Coinbase Premium) and institutional accumulation suggest growing demand.
- Macro and sector dynamics (liquidity, ETF flows, altcoin rotations) introduce both tailwinds and risks.
- If the historical pattern holds, Bitcoin could target $150,000 to $170,000 by year end, though volatility and macro factors may disrupt the trend.
1. Historical Patterns: Green September and Q4 Rallies
Bitcoin’s recent performance shows it ended September with a gain of approximately 4.5%, bringing its price to around $113,100. This is notable because September is often one of Bitcoin’s weakest months historically, yet when it breaks out positively, it tends to trigger strong momentum for the final quarter.
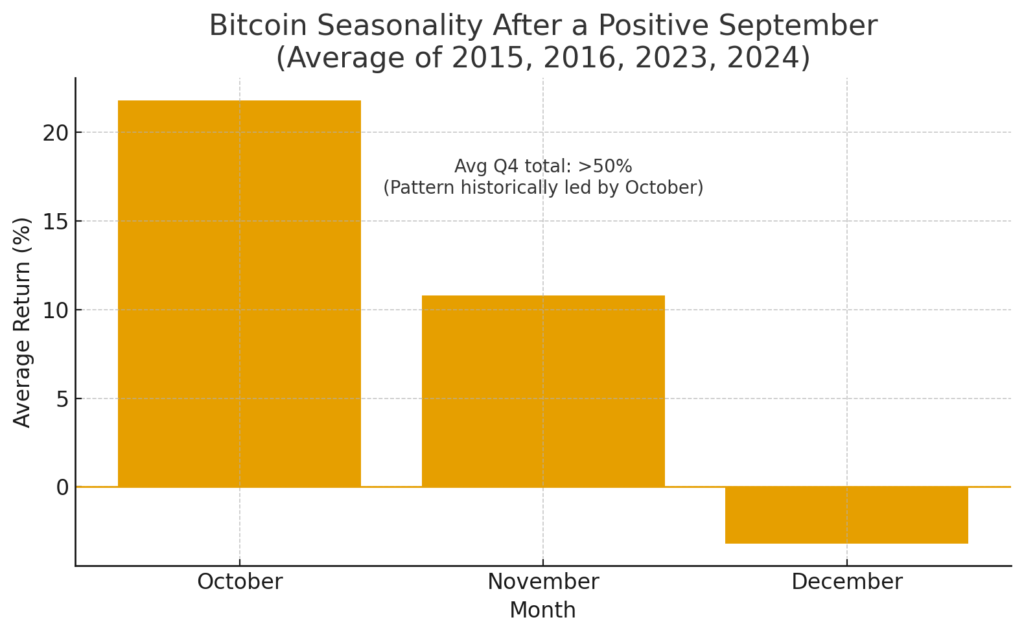
Looking back at years when September closed green (2015, 2016, 2023, 2024), the Q4 returns were dramatic: average gains exceeding 53 % over October–December. Within those, October historically averaged ~21.8%, November ~10.8%, while December often cooled or even declined slightly. Over full quarters, past Q4 gains ranged from 45% to 66%.
Some analysts have extrapolated from that pattern to estimate that Bitcoin could revisit new highs near $170,000 by year-end, assuming the same trajectory repeats. Others are more conservative, pointing to a potential range of $130,000 to $150,000 as plausible outcomes.
It’s important to emphasize that historical performance does not guarantee future results, but these recurrent patterns offer a useful lens for scenario planning.
2. On-Chain Signals and Market Flows: Building the Case for Accumulation
Beyond seasonal patterns, several on-chain and market metrics support a bullish interpretation for Q4.
Spot Taker CVD (90-Day)
The Spot Taker Cumulative Volume Delta (CVD) measures the net difference between market (taker) buys and sells over a 90-day window. A positive shift indicates taker-buy dominance — that is, incoming buyer pressure overcoming seller flows.
As of this month, the 90-day Spot Taker CVD has turned positive again — its first green signal since mid-July. This suggests that new demand is reemerging in the spot market, consistent with accumulation phases in prior cycles.
Coinbase Premium
The Coinbase Premium Index captures the price difference between BTC on Coinbase (USD spot) and BTC price on exchanges like Binance (USDT pair). A sustained positive premium implies stronger US retail or institutional demand, especially from onshore USD flows.
Despite recent volatility, the premium has remained elevated. For example, even when BTC dipped to ~$112,000, the premium rose from ~0.043 to 0.075, signaling continued buyer interest. Analysts interpret this as evidence that US-based accumulation is a consistent underpinning of strength.
When the Spot Taker CVD and Coinbase Premium align positively, the bullish case strengthens — the market is showing matching impulses of momentum and demand.
Other On-Chain & Market Metrics
- Some analysts point to the MVRV Z-Score (market value vs. realized value) as still implying room for upside before overvaluation zones are reached.
- The Pi Cycle Oscillator and other cycle-based tools remain in bullish momentum phases, though sensitivity to macro shifts (e.g. USD strength) could test them.
- ETF inflows and institutional accumulation remain an important backdrop, especially as major asset managers and public companies increase their BTC exposure.
Taken together, these signals indicate that the undercurrents of demand are still intact, providing ammunition for the seasonal narrative.
3. Macro & Sector Trends: Opportunities and Risks for Q4
While seasonal and on-chain framing suggests a favorable setup, several macro and sector dynamics could amplify or derail the move.
Liquidity, Rates & Policy
One key support factor is the anticipation of interest rate cuts by major central banks, including the US Federal Reserve. Lower policy rates and looser liquidity tend to favor risk assets like Bitcoin.
However, inflation surprises, rate hawkishness, or USD strength (DXY rebound) could challenge crypto upside.
Relative Performance & “Alt Season”
Grayscale’s Q4 2025 outlook suggests that Bitcoin has underperformed relative to other crypto sectors in Q3, hinting at a possible altcoin season dynamic in the months ahead. In their taxonomy, sectors such as smart contract platforms, finance, and digital asset treasuries (DATs) have shown stronger momentum.
This implies two things: (1) capital may rotate from BTC into selected altcoins if thematic strength emerges; (2) BTC’s rally could drag along the broader market, especially if the narrative is strong enough.
Volatility & Leverage Risks
Q4 is often a period of heightened volatility, partly due to large options expirations and whale positioning around “max pain” levels. Some quarters amplify sharp moves both up and down.
Backtests of breakout strategies (e.g. buying upon a resistance breakout and holding 30 trading days) show average returns around 21.6%, but with drawdowns of up to ~40%. That underscores the importance of risk controls, stop losses, and position sizing.
Structural Shift: Halving Impact & Maturation
Bitcoin’s most recent halving occurred in April 2024, which reduced miner issuance and heightened scarcity. Historically, post-halving years deliver strong gains. However, 2025 has seen more modest returns compared to past cycles, raising debates about whether halving’s boost is waning in a maturing market.
This evolving market structure — characterized by institutionalization, ETF flows, and lower volatility – may dampen extreme swings, but also temper upside potential.
4. Forecast Scenarios & Strategy Framework
Based on historical patterns, on-chain metrics, and macro context, here are a few plausible scenarios and strategic takeaways.
Scenario A: Strong Breakout — $150K to $170K by Year End
- If seasonality repeats and demand continues, Bitcoin could rally ~50%+ from current levels.
- October may lead the charge (~20–25% gain), November adds ~10%, and December serves to consolidate.
- In this scenario, BTC might target $150,000 to $170,000, approaching new all-time highs.
- Altcoins might likewise surge, but BTC’s dominance may temporarily reassert.
Scenario B: Moderate Rally with Pullbacks — $130K to $150K
- A bullish trend with intermittent corrections becomes the path.
- BTC may reach $140–150K, but weak macro data or profit-taking pressure could lead to pullbacks.
- Volatility remains elevated; directional moves may be choppy.
- Rotation into high-conviction altcoins might occur mid-quarter.
Scenario C: Range, Volatility, or Disappointment
- If macro headwinds dominate (e.g. inflation surprises, Fed hawkishness), BTC could stall or even retrench.
- The rally could be muted, with ranges between $100K–$130K.
- In this case, strategy might need to lean defensive: hedges, exposure caps, and nimble rotation.
Strategy Recommendations (for readers hunting new alts or income opportunities)
- Prioritize risk management — limit individual positions to 10–15% of portfolio, especially in volatile regimes.
- Use technical trigger levels — if BTC breaks beyond a strong resistance (e.g. ~$115K), it may validate the move.
- Monitor on-chain alignment — sustained positive Spot Taker CVD + Coinbase Premium is a powerful confirmation barometer.
- Allocate to sector themes — if alt sectors (DeFi, infrastructure, tokenized finance) lead, allocate to high-conviction tokens.
- Hedging & optionality — use options or crypto futures where available to hedge downside during expiries.
5. Summary & Outlook
Bitcoin’s rare green September close has lit a traditional seasonal fuse: historically, such closes precede strong Q4 rallies. When combined with bullish on-chain signals (Spot Taker CVD flipping positive, persistent Coinbase premium) and continuing institutional accumulation, the technical and demand backdrop looks supportive. That said, macro risks (rate policy, USD strength), volatility, and evolving structural dynamics warrant caution.
If the historical pattern repeats, Bitcoin may surge toward $150,000 to $170,000 by year-end — but a more modest rally in the range of $130,000 to $150,000 seems more conservative. The most dangerous outcome would be a stalled breakthrough where price ranges and volatility dominate.
For those hunting new crypto opportunities, the coming quarter might reward not only exposure to BTC but also alertness to altcoin themes, sector rotations, and yield strategies. The key is not necessarily to predict the precise number, but to ride momentum while maintaining disciplined risk control.