Key Points :
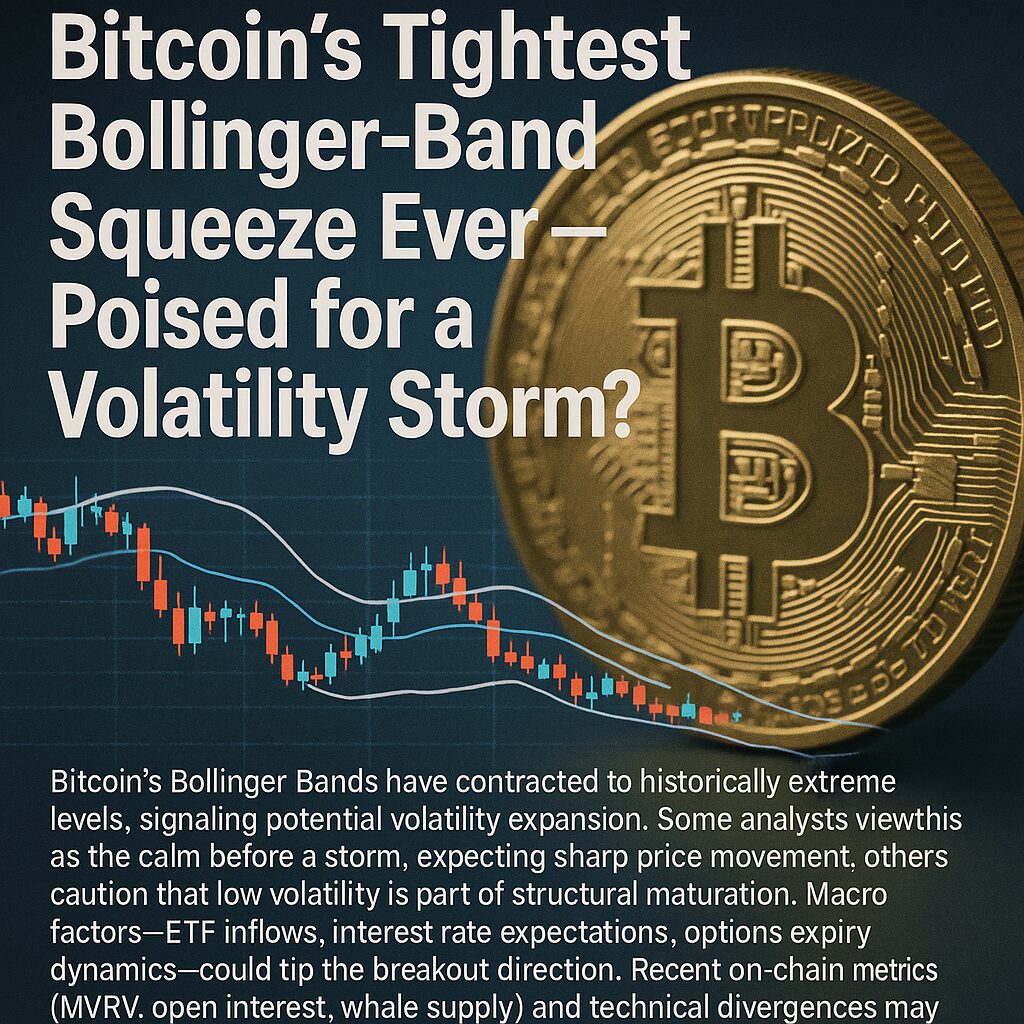
- Bitcoin’s Bollinger Bands have contracted to historically extreme levels, signaling potential volatility expansion.
- Some analysts view this as the calm before a storm, expecting sharp price movement; others caution that low volatility is part of structural maturation.
- Macro factors—ETF inflows, interest rate expectations, options expiry dynamics—could tip the breakout direction.
- Recent on-chain metrics (MVRV, open interest, whale supply) and technical divergences may help indicate whether the next move is up or down.
- While the squeeze suggests opportunity, risk management is critical given the potential for false breakouts and leveraged liquidations.
Introduction: The Squeeze That Has the Market on Edge
Bitcoin’s volatility has quietly compressed to unprecedented levels, with its Bollinger Bands narrowing to extremes not previously recorded in its history. In many technical trading systems, such intense contraction is viewed as a precursor to expansion—price must “make space” after a period of quiet. This has led a growing chorus of analysts to warn that Bitcoin may be setting up for a dramatic move, though debate still rages over whether that move will be upward, downward, or full of whirlwinds in both directions.
In this article, I first summarize the key arguments from recent reports (including Japan’s article). Then I extend the discussion by adding fresh data and commentary from 2025, on-chain signals, and cautionary perspectives. Finally, I synthesize these into a set of tactical considerations for readers seeking new crypto opportunities or exploring blockchain use cases.
1. The Historic Contraction: What the Original Article Reported
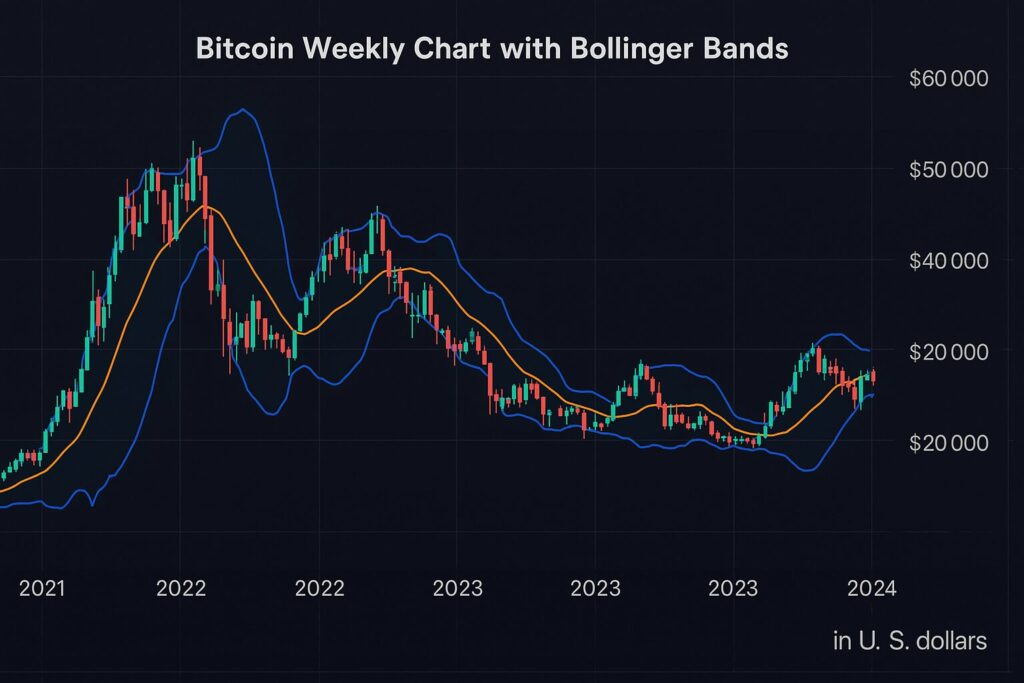
1.1 The Narrowing Bollinger Bands
The original article reports that Bitcoin’s weekly Bollinger Bands are shrinking to their narrowest levels ever. The compression has drawn comparisons to “the calm before a storm”—a lull that precedes a major volatility eruption. Analysts like “Mr. Anderson” emphasize that extreme contraction in volatility tends to be followed by expansion, often including price movements that test the upper or lower bands.
1.2 Analyst Opinions: Storm Ahead?
- Nassar Achkar (CoinW) frames the squeeze as a foreshadowing of a major volatility event.
- Web3 Hunters’ founder Langerius warns that such extreme compression rarely resolves quietly.
- Contrarily, the Glassnode researcher “CryptoVizArt” offers a counterpoint, arguing that as Bitcoin’s market size grows, volatility compresses on all timeframes—and thus band narrowing may not carry predictive value.
1.3 Historical Patterns — Precedent for Breakouts
The article recounts past episodes: in early July, with bands extremely tight around ~$10,800, volatility then expanded and Bitcoin crossed $12,200. A similar contraction in the September base preceded high volatility. These analogies provide a historical anchor for the claim that compression often foreshadows breakout.
1.4 Diverging Forecasts: “Septbear” vs “UpTober”
As October approaches, analysts diverge. Some, like IG’s Tony Sycamore, expect a corrective pause to cool overheated markets. Others point to historical seasonality: Bitcoin has risen in 10 of the past 12 Octobers and in 8 of the past 12 Q4s. The question is whether this contraction births a bullish breakout (so-called “UpTober”) or a deeper retracement (“Septbear”).
2. Fresh Data & Recent Developments (Mid/Late 2025)
To sharpen the lens, here is a view of where things stand as of September 2025.
2.1 Record-Low Volatility in 2025
Bitcoin’s implied volatility recently dipped to its lowest in two years. On-chain metrics echo the calm: exchange balances are declining, and open interest has dropped sharply following recent deleveraging. Meanwhile, long-term trends show that Bitcoin’s volatility has been gradually declining over its lifecycle—a sign of a maturing asset class.
2.2 The New “Most Extreme” Band Contraction
Multiple reports now assert that the current Bollinger squeeze is the most severe in Bitcoin’s history. Binance claims the bands are tightest since 2009, with the potential for dramatic volatility ahead. Analysts reference similar compressions in 2012, 2016, 2020—all preceding sizable upward runs.
2.3 Price Reaction & Technical Divergences
Bitcoin recently rebounded to $113,900 after bouncing from $111,000, and bullish RSI divergence has emerged—price lows pushed lower while RSI lows rose, hinting weakening bearish momentum. In parallel, implied volatility of Bitcoin options is at multi-year lows—market expectations appear complacent.
2.4 Options Expiry, “Max Pain” Levels & Forced Moves
Ahead of a large options expiry (≈ US$17.5 billion), traders have latched onto a “max pain” level near $107K, where losses for option holders would be maximized. The mechanics of pinning, gamma squeeze, or forced liquidations could exacerbate directional overshoots.
2.5 On-Chain Context: MVRV, Supply & Open Interest
- The MVRV (market value to realized value) ratio sits in a neutral zone, suggesting neither extreme overvaluation nor undervaluation.
- Whales have offloaded ~147,000 BTC since August, introducing overhead supply pressure.
- Open interest dropped ~16% in the latest deleveraging wave.
- Exchange outflows continue, meaning fewer BTC are held in hot wallets accessible to traders, consistent with “cold hands” holding.
2.6 Macro Backdrop & Institutional Flows
ETF inflows and expectations of further U.S. Federal Reserve rate cuts remain bullish tailwinds. However, significant leverage on derivatives markets (~USD 220 billion) could amplify moves and trigger cascades of liquidations.
3. Interpreting the Signals: Scenarios & Probability Tilt
Given the data above, what scenarios are plausible—and how should opportunistic crypto seekers think about positioning?
3.1 Scenario A: Bullish Breakout
If Bitcoin breaks decisively above the upper band, accompanied by rising volume and expansion in implied volatility, it could target new highs. Some technical projections even point to a “cup-and-handle” breakout targeting $300,000+ over 2025–26.In that scenario, the squeeze would prove prescient, and momentum traders could reap outsized gains.
3.2 Scenario B: Bearish Breakdown
On the flip side, failure to hold support could lead to a breakdown below the lower band. Given the degree of leverage in the system, cascading liquidations could intensify declines. If macro headwinds (e.g. hawkish Fed surprises) coincide, the move could get messy.
3.3 Scenario C: False Breakouts / Whipsaw
One risk mode is a “blow-off fake” breakout: price initially breaks out, draws in momentum buyers, then reverses back inside the bands and traps participants. In such cases, volatility may expand and contract again before a sustained trend forms.
3.4 Tilt of Probability
While both directions are possible, the weight of macro tailwinds (ETF flows, accommodative rate expectations) combined with historical precedents suggests a modest tilt toward bullish breakout. Still, the margin for error is slim, and any position must respect risk limits.
4. Tactical & Practical Takeaways for Crypto Seekers
4.1 Use Band Edges as Trigger Zones
Set conditional entries just beyond the upper and lower bands, with stop losses anchored near the mid-band (e.g. 20-day SMA) or recent swing extremes. This honors the squeeze-to-expand logic while limiting whipsaw risk.
4.2 Monitor Confirmation Metrics
Wait for confirming volume, rising implied volatility, or momentum divergences before fully committing. A clean breakout sans confirmation is vulnerable to failure.
4.3 Layered Entries & Risk Management
Given the high-stakes nature, a laddered entry approach (partial exposure first, add on confirmation) is safer than going all-in. Consider hedges (options, inverse products) to protect against reverse moves.
4.4 On-Chain and Sentiment Alerts
Watch MVRV deviations, exchange inflows/outflows, open interest buildup, and whale behaviors. If one side starts loading aggressively, it may portend direction. Also be alert to macro shocks (rates, regulation) which can override technical setups.
4.5 Opportunity for Altcoins & Infrastructure Plays
If Bitcoin enters a volatility expansion, many mid-cap altcoins or protocol layer projects (not just speculative tokens) may benefit from renewed risk appetite. For those interested in blockchain’s practical uses, infrastructure tokens (layer-1, middleware, DeFi rails) stand to gain from capital rotation.