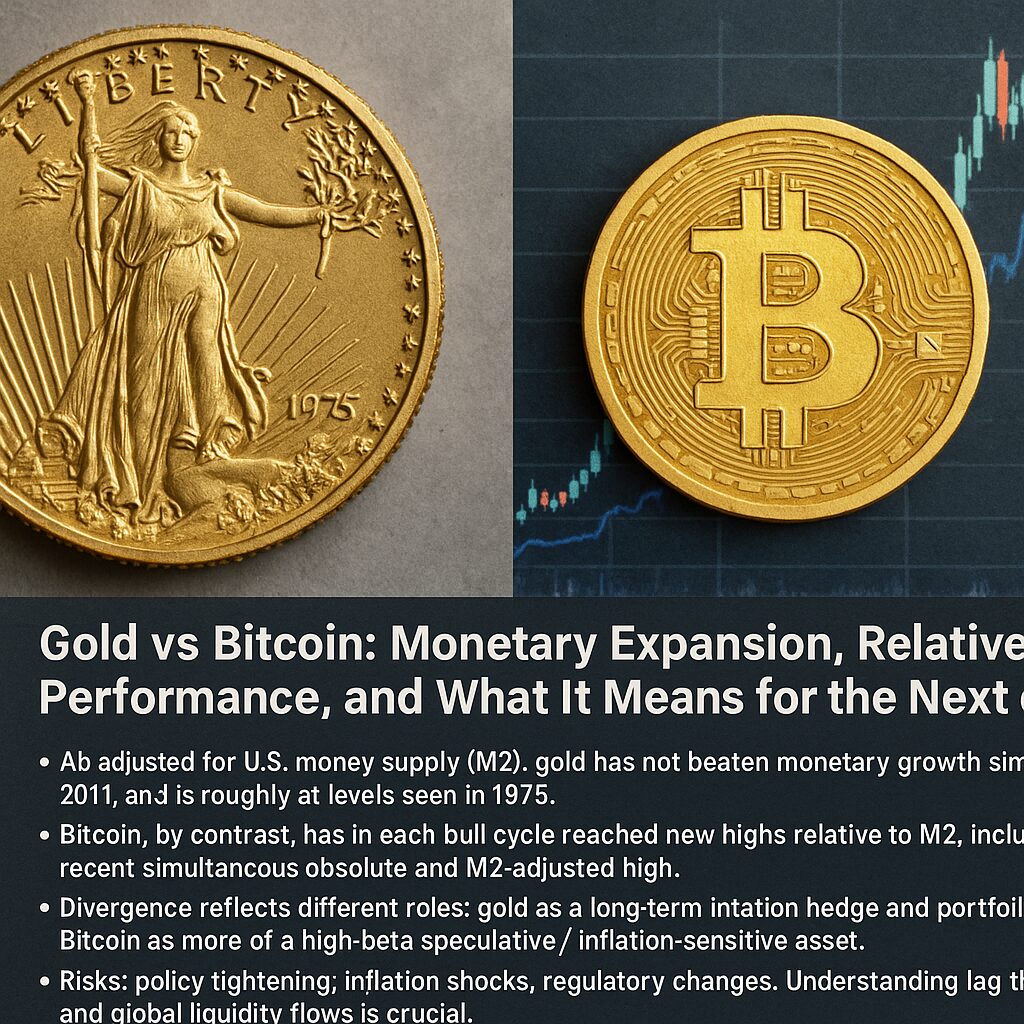
Main Points :
- When adjusted for U.S. money supply (M2), gold has not beaten monetary growth since 2011, and is roughly at levels seen in 1975.
- Bitcoin, by contrast, has in each bull cycle reached new highs relative to M2, including a recent simultaneous absolute and M2-adjusted high.
- The divergence reflects different roles: gold as a long-term inflation hedge and portfolio stabilizer; Bitcoin as more of a high-beta speculative / inflation-sensitive asset.
- Recent trends: global M2 is peaking; institutional demand for Bitcoin is rising; many analysts see possible targets for BTC into six figures; M2‐BTC correlation is being used as a signal.
- Risks: policy tightening, inflation shocks, regulatory changes. Understanding lag times and global liquidity flows is crucial.
1. Gold’s Performance Adjusted for M2: Underwhelming in the Long Run
Since 2011, gold has not managed to exceed the growth of the U.S. money supply (M2) when properly adjusted. Despite gold’s strong price gains in 2025 (around +38 % year-to-date) which have outdone Bitcoin’s approx +23 % in dollar terms, once you consider how much more money (liquidity) is in the system, gold’s real, inflation-or liquidity-adjusted performance remains relatively weak. As reported, gold’s level versus M2 stays below its 2011 peak and is roughly similar to where it was back in 1975. The last time gold made a all-time high relative to M2 was in 1980.
This suggests that though gold is useful as a hedge and is still being bought (especially in times of geopolitical risk or by central banks), its capacity to reflect monetary expansion in its price has been limited over decades. It has been stable, but has not meaningfully “ride the wave” of money-printing as much as Bitcoin has.
2. Bitcoin vs M2: New Highs, Strong Correlations, and Momentum
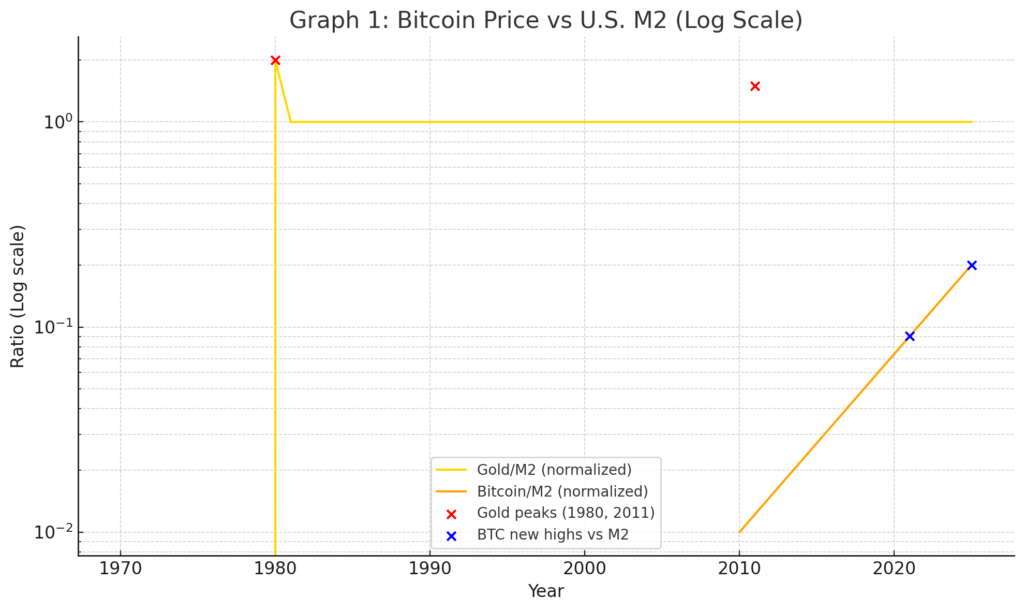
Bitcoin’s story is markedly different. Each major bull cycle for BTC has seen not only an absolute high in dollar price but also a new high relative to U.S. M2 money supply. Very recently, Bitcoin achieved both an absolute all-time high and a new M2-adjusted high.
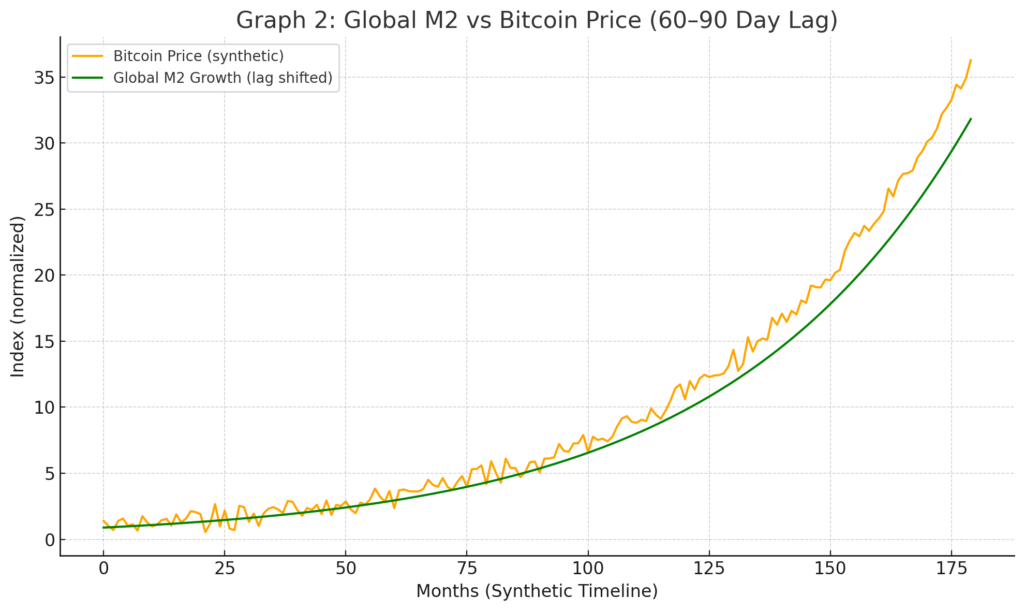
Beyond just U.S. M2, global M2 / global liquidity trends are being watched closely. For instance, U.S. M2 reached ~$21.94 trillion recently, which is historically high. Analysts point out that Bitcoin tends to follow such liquidity expansions after a lag (often several weeks to a few months).
Other observations include:
- Global M2 across major economies (US, China, EU, Japan) is at record levels, fueling expectations that risk-assets like BTC will benefit.
- Institutional demand for Bitcoin has ramped up, including via ETFs, corporate treasuries, and regulatory clarity, which supports the view that Bitcoin is increasingly being viewed not just as a speculative asset but one responding to macro-monetary trends.
3. Roles & Implications: Hedge, Speculation, or New Monetary Form?
The divergence between gold and Bitcoin when adjusted by money supply reveals differentiated roles:
- Gold remains a long-standing hedge: stability, recognized across centuries, central banks continue to hold it, its value holds up in crises or under geopolitical stress. But its relative performance in a money-printing era is modest.
- Bitcoin behaves more like a high-beta inflation / liquidity play: in times of monetary expansion, its returns (both absolute and relative to M2) tend to be large and often lead the broader asset flows. The volatility is much greater, the infrastructure newer, and risk higher, but also upside potential seems larger.
For practitioners or investors looking for next revenue sources or new crypto assets: Bitcoin illustrates what can happen when an asset is deeply sensitive to liquidity, adoption, regulatory clarity, and global capital flows. Any new asset or blockchain project that can somehow embed similar leverage to liquidity trends may offer outsized returns—but also greater downside.
4. Recent Trends and What’s Moving Now
Here are some of the more recent developments beyond what was in the original article:
- Record High U.S. & Global M2: U.S. M2 has recently hit ~$21.94 trillion. Global M2 across key economies (US, China, EU, Japan) also at or near all-time highs.
- Lag Effects: Many analyses suggest Bitcoin responds with a lag of ~60-90 days after major upward shifts in M2 or global liquidity. This has become a tool used by traders and institutional analysts to anticipate price moves.
- Institutional Adoption & Regulatory Clarity: There’s more recognition by governments and financial institutions. For example, ETFs, oversight, clearer legal frameworks. This reduces some tail risk and makes BTC more accessible.
- Targets & Sentiment: Some price targets are in the $130,000-$170,000 range (or higher) if the liquidity expansion persists, particularly with policy easing or rate cuts. But analysts warn resistance, profit-taking, and regulatory or inflation spikes may cap or reverse moves.
5. Risks and Constraints
While the picture is bullish for Bitcoin relative to money supply expansion, there are several important caveats:
- Interest Rate Policy: If central banks tighten unexpectedly, or inflation forces rate hikes, liquidity could retract, hurting all risk assets and particularly volatile ones like Bitcoin.
- Regulation: Changes in regulation (crypto unfriendly rules, tax burdens, restrictions) could introduce sharp downward risks.
- Market Sentiment & Volatility: Bitcoin’s volatile nature means that big gains can be reversed quickly. Overconfidence in M2 correlation can backfire if other macro shocks arise.
- Lag Timing Uncertainty: Although historical patterns suggest lags (weeks to months), exact timing is variable. One must manage exposure accordingly.
- Alternative Assets & Competition: Newer crypto assets, blockchain projects, or digital assets may disrupt or split capital flows from Bitcoin; also gold retains certain psychological and institutional trust, particularly under crisis scenarios.
Summary and What to Watch
In summary, when assessing gold versus Bitcoin through the lens of monetary expansion (especially U.S. M2 and global liquidity), Bitcoin appears to be the asset that better captures periods of rising money supply. Gold remains valuable, especially as a hedge or safe-haven, but has struggled over decades to keep pace relative to the flood of liquidity. For those hunting new crypto assets or revenue sources, Bitcoin’s example suggests that alignment with macro liquidity, institutional adoption, and regulatory clarity are key.
What to monitor in the coming months:
- Further expansion (or contraction) of U.S. and global M2.
- Interest rate decisions from major central banks (Fed, ECB, PBoC etc.).
- Regulatory developments affecting crypto, ETFs, taxation.
- Institutional flows into Bitcoin and related assets.
- The timing of Bitcoin’s reaction relative to liquidity surges (lagged behavior).
For anyone looking into new blockchain projects or crypto assets, the lesson is: build for macro sensitivity, clarity, utility, and consider how your asset behaves in a high-liquidity, inflation-aware environment. Bitcoin is not perfect, but it’s shown a model of how an asset can outperform in such conditions.


