Main Points:
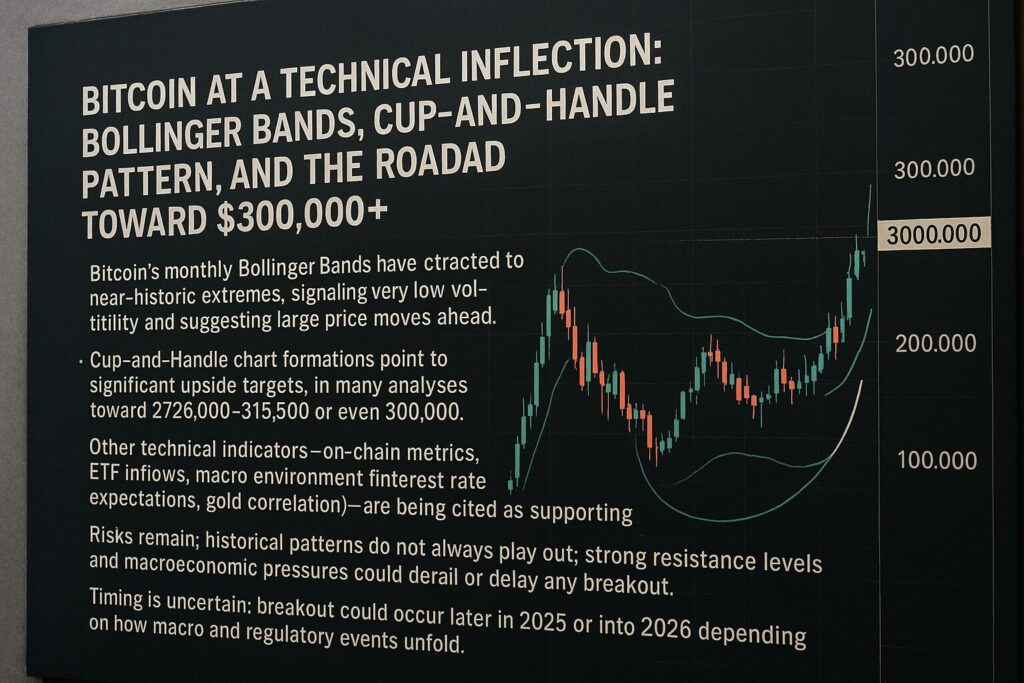
- Bitcoin’s Bollinger Bands on the monthly chart have contracted to what many analysts call the most extreme level since 2009, suggesting an imminent breakout.
- Technical patterns, notably a “cup-and-handle,” combined with strong tailwinds (ETF demand, institutional accumulation, macro expectations), are pointing toward a possible price target around US$300,000 for BTC in 2025–2026.
- ETF inflows have picked up significantly — both globally and in the U.S. — helping to shift sentiment and tighten supply as institutions withdraw BTC from exchanges.
- On‐chain metrics (such as short‐term holder MVRV reaching breakeven, reduced selling pressure by large holders, accumulation) reinforce the bullish setup while macro indicators like Fed policy and inflation data are increasingly viewed as supportive.
- However, caution is warranted: historical success of patterns like cup-and-handle is not universal (some research puts target attainment around ~61%), risks remain (macro/regulatory), and price behavior could also see sharp reversals or corrections.
1. Bollinger Bands at Rare Extremes
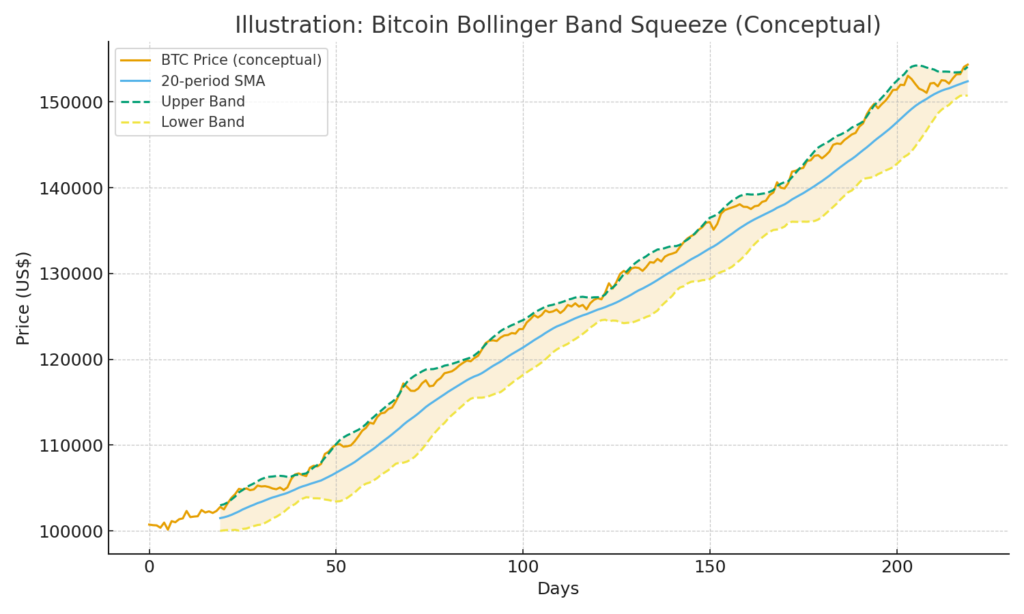
Bitcoin’s Bollinger Bands — a technical indicator that measures volatility by mapping a moving average with bands placed at certain standard deviations above and below it — have squeezed to a level rarely seen in history on the monthly timeframe. Analyst Matthew Hyland has noted that the current tightness is the most extreme since Bollinger Bands were introduced back in January 2009.
Historically, periods of tight Bollinger Bands (low volatility) have preceded explosive moves in price — especially to the upside — as accumulation builds under the surface and supply becomes constrained. The current braid of extremes suggests rising tension: either a breakout upward or a sharp reversion. Many traders are leaning toward the former, given the surrounding supporting factors.
2. The Cup-and-Handle Pattern & Price Targets
A classical pattern in technical analysis, the “cup-and-handle” formation, has been identified in the BTC monthly chart. The “cup” formed leading up to when the price broke above a key neckline (around US$69,000) in November 2024. From there, the “handle” is in process of being validated.
If this pattern follows historical precedent, the measured move from the bottom of the cup to the neckline then projects a breakout target around US$300,000–US$305,000 over the 2025–2026 timeframe — implying over 170% upside from current levels.
3. ETF Inflows & Institutional Demand
Flow data reveals renewed and growing demand for BTC through spot Bitcoin ETFs. For example, recent weeks saw US$2.48 billion in net inflows into crypto investment products, with a substantial portion going into Bitcoin ETFs.
In the U.S., some prominent funds, especially BlackRock’s IBIT, have gathered large amounts of capital, even while smaller or more speculative funds have seen mixed flows. Meanwhile, long‐term holders are also realizing profits, but institutions are taking up supply that leaves exchanges, tightening floating supply.
4. On-chain Signals & Macro Tailwinds
Multiple on‐chain metrics are lining up in a way that supports a bullish thesis:
- Short‐term holder MVRV (market value vs realized value) has reached breakeven levels, a signal that has in prior cycles coincided with bottoms or stabilization phases.
- Large holders (whales, institutions) have been accumulating, withdrawing BTC from exchanges, which tends to reduce supply pressure. ト
- Macro trends are favoring easing expectations: weaker U.S. labor data, rising hopes for Federal Reserve rate cuts, and a softer dollar are among tailwinds. These can drive capital into BTC as an inflation hedge or risk asset with upside.
5. Risks, Caveats, and Alternative Scenarios
While the case for major upside is compelling, it’s not without risk:
- Technical patterns like cup‐and‐handle do not always reach their targets; the historical “success rate” for that pattern is often quoted around 60-65% under ideal conditions.
- Macroeconomic and regulatory risks remain material: any unexpected tightening (interest rates, inflation rebound), adverse regulation, or geopolitical shocks could reverse momentum.
- Even with ETF inflows, price is not guaranteed to chase immediately; sometimes accumulation precedes long periods of consolidation.
- Possible scenario: BTC may retest support (e.g. US$100,000–110,000) before resuming upward trajectory, or perhaps see a period of volatility that includes sharp pullbacks.
6. Recent Trends / Updates (Beyond the Original Article)
To give more up‐to‐date color:
- Weekly inflows into crypto investment products remain strong; the year‐to‐date total is significantly higher than the same period last year.
- Spot Bitcoin ETFs in the U.S. have seen multiple days of inflows, sometimes reversing prior outflows. Volume among major funds (like IBIT) continues to grow, adding weight to institutional demand.
- Prices are currently consolidating in the range of US$110,000-113,000, with some resistance near US$113,400 and support near US$108,000, as traders await a clear break or rejection.
Summary & Outlook
Bitcoin appears to be at a pivotal moment. The convergence of several technical, on‐chain, and macro indicators suggests that we may be on the cusp of a major upward move. The contraction of Bollinger Bands to historically extreme levels indicates pent‐up volatility, and the cup‐and‐handle formation points to a potential target of around US$300,000 for 2025-2026, under favorable conditions.
Institutions are adding to the bullish case: strong ETF inflows, supply tightening, and accumulation by large holders all reinforce upward pressure. Macro conditions (expectations of rate cuts, soft labor data, inflation dynamics) seem to be aligning to support the case for risk assets — and for BTC in particular.
However, caution is justified. Patterns don’t always reach their theoretical targets. External risks (regulation, global macro) could derail or delay upside. And price behavior may involve shake‐outs, consolidations, or deeper corrections before a sustained run.
If I were advising someone looking for opportunities, I’d say now is a time to consider positioning, but with careful risk management: define stop losses, perhaps scale in rather than load up, monitor macro/regulatory environments carefully. For those seeking next potential crypto or blockchain opportunities, BTC may increasingly act as a bellwether: its behavior could inform sentiment and flow into other assets.