Key Takeaways :
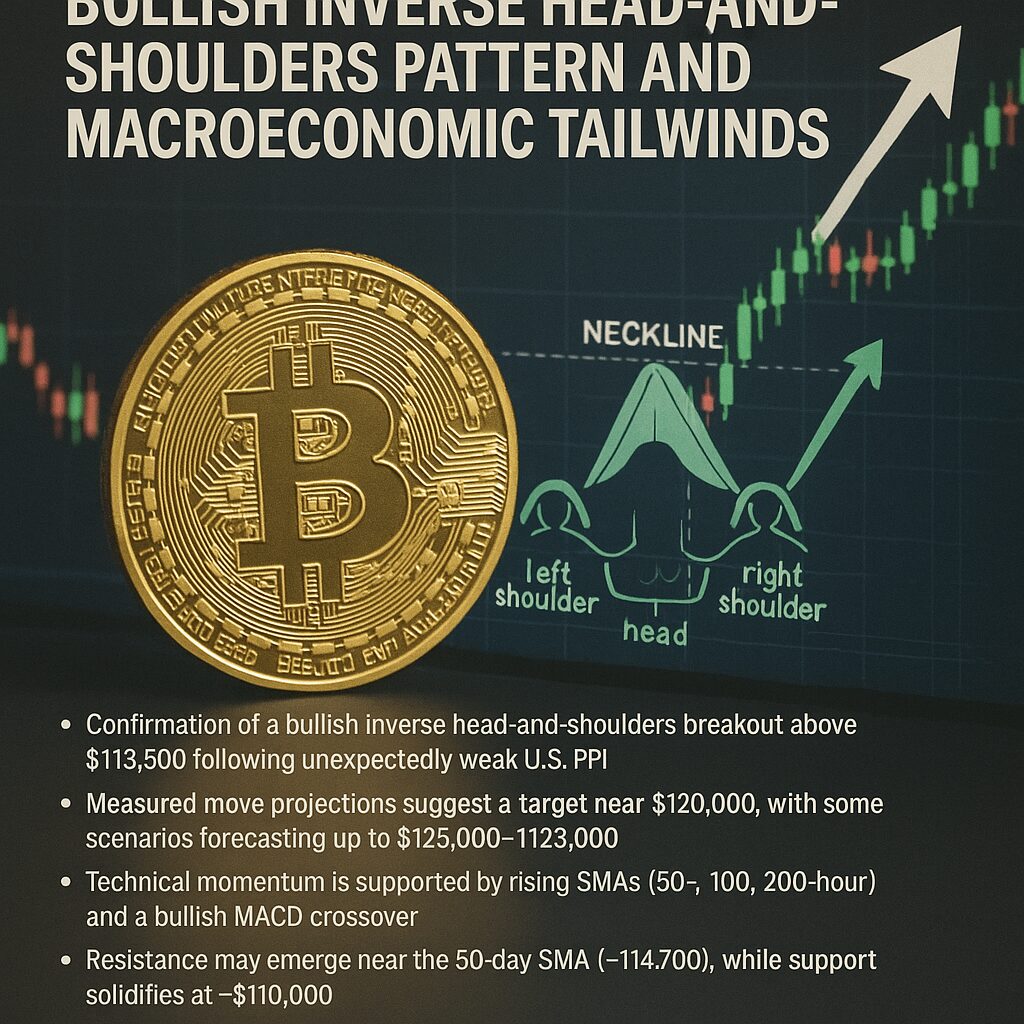
- Confirmation of a bullish inverse head-and-shoulders breakout above $113,600 following unexpectedly weak U.S. PPI.
- Measured move projections suggest a target near $120,000, with some scenarios forecasting up to $125,000–$128,000.
- Technical momentum is supported by rising SMAs (50-, 100-, 200-hour) and a bullish MACD crossover.
- Resistance may emerge near the 50-day SMA (~$114,700), while support solidifies at ~$110,000.
- Macroeconomic developments—especially April’s PPI miss and rate cut expectations—strengthen BTC’s bullish narrative.
- Risk factors remain: false breakouts, regulatory uncertainty, inflation surprises, and potential volatility ahead of CPI or Fed decisions.
1. Chart Pattern Breakout: Inverse Head-and-Shoulders Signals Bullish Reversal
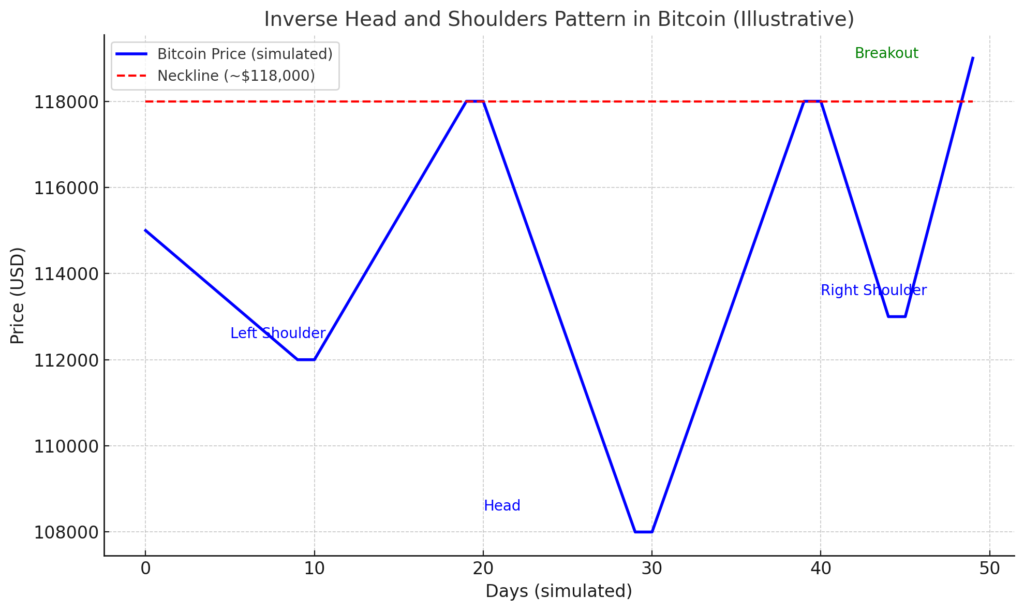
On September 10, 2025, Bitcoin broke decisively above the $113,600 level, confirming a classic bullish technical reversal: the inverse head-and-shoulders (H&S) pattern. This pattern typically marks a shift from bearish sentiment to bullish momentum—featuring a low (left shoulder), a deeper low (head), and a higher low (right shoulder), with a neckline connecting the intervening peaks. The breakout above that neckline validates the pattern.
2. Target Projection: $120K–$128K in Sight
Using the “measured move” technique—adding the distance from the head’s lowest point to the neckline to the breakout level—analysts project a likely target near $120,000. AInvest.com suggests even higher potential upside toward $125,000–$128,000, citing combined technical formations and institutional inflows. Investing.com notes targets near $117,000 as well, depending on momentum.
3. Technical Momentum: SMAs and MACD Confirm Strength
Multiple technical indicators underscore strengthening bullish momentum: the 50-hour, 100-hour, and 200-hour simple moving averages are all trending upward. Additionally, the daily MACD histogram crossing above zero reinforces improving market sentiment. These signals suggest buyers are regaining control following the recent pullback from above $124,000.
4. Key Levels: Resistance, Support, and Potential Invalidations
- Resistance: The 50-day SMA near $114,700 stands as the immediate hurdle for bullish continuation.
- Support: Bears must defend $110,000; if this level fails, the bullish setup could unravel.
- Some technical scenarios extend speculation to levels as high as $129,000 based on Fibonacci extensions and rising wedge breakouts.
5. Macroeconomic Catalyst: Softer U.S. PPI Fuels Rate-Cut Hopes
The breakout coincided with weaker-than-expected U.S. Producer Price Index (PPI) data: August PPI declined 0.1% month-over-month vs. forecasts for 0.3% growth, and core PPI underperformed as well. This single data point fueled speculation of Federal Reserve rate cuts, thereby improving risk appetite and benefiting Bitcoin as a speculative asset.
6. Broader Market Context and Emerging Risks
- Crypto Market Sentiment: Global crypto market cap rose ~2.1%, as traders interpreted Bitcoin’s breakout as a sign of renewed strength.
- ETF Activity and Whale Behavior: While late August saw substantial outflows and whale selling, these have cooled, limiting downside pressure.
- AI and Institutional Drivers: Broader risk-on market environment—spurred by AI-related equity rallies—adds tailwinds, though crypto remains somewhat disconnected from these dynamics.
- Risks to Watch: Analysts warn of potential false breakouts, looming regulatory shifts, inflation surprises, and institutional token unlocks. Importantly, upcoming U.S. CPI and Fed policy decisions could validate or countercurrent market moves.
7. Summary and Outlook
In summary, Bitcoin’s breakout above $113,600 has confirmed a classic inverse head-and-shoulders reversal, supported by technical indicators and macroeconomic tailwinds. The measured move targets place Bitcoin in reach of $120,000, with some scenarios extending toward $125K–$128K. Resistance and support levels around $114.7K and $110K, respectively, should be closely monitored. Softer U.S. inflation data has rekindled rate-cut hopes, providing further fuel for bullish momentum. However, geopolitical, regulatory, or economic shocks could derail the setup. Future moves will likely hinge on upcoming CPI data and Fed communications.