Key Highlights :
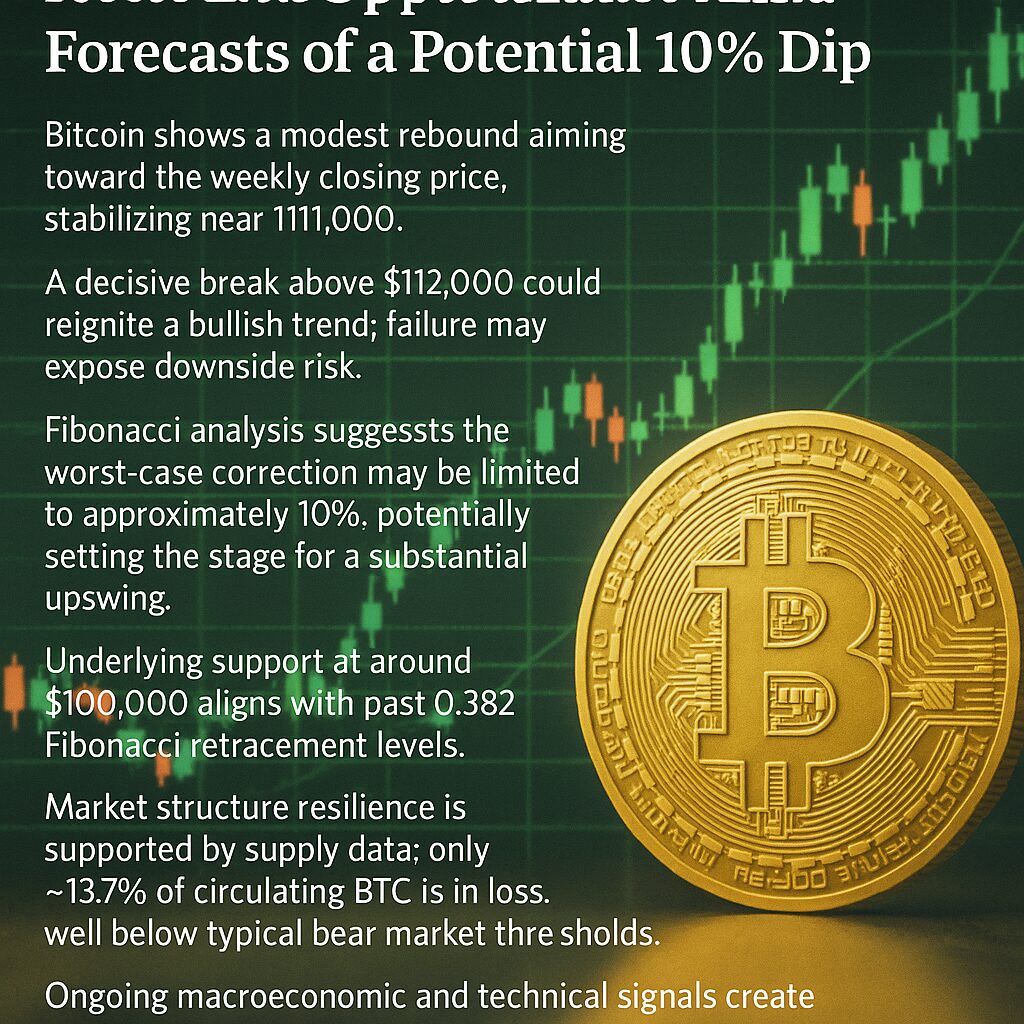
- Bitcoin shows a modest rebound aiming toward the weekly closing price, stabilizing near $111,000.
- A decisive break above $112,000 could reignite a bullish trend; failure may expose downside risk.
- Fibonacci analysis suggests the worst-case correction may be limited to approximately 10%, potentially setting the stage for a substantial upswing.
- Underlying support at around $100,000 aligns with past 0.382 Fibonacci retracement levels.
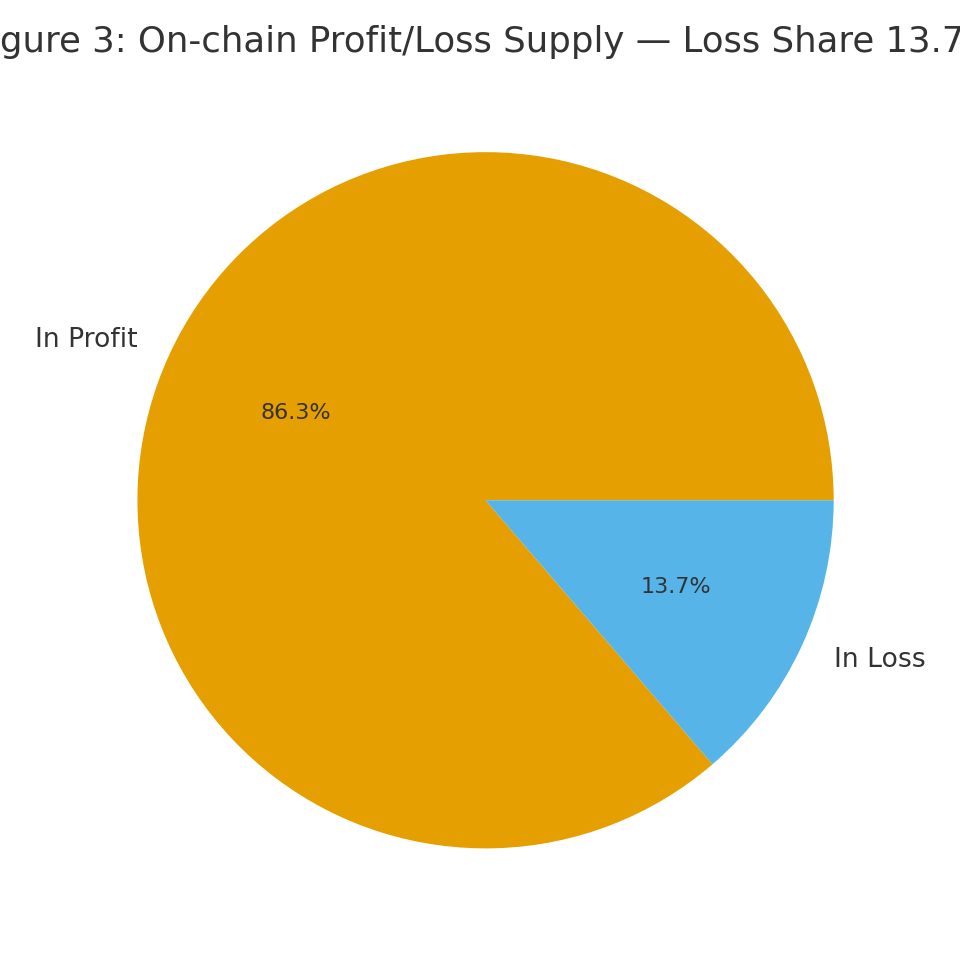
- Market structure resilience is supported by supply data: only ~13.7% of circulating BTC is in loss, well below typical bear market thresholds.
- Ongoing macroeconomic and technical signals create a cautiously optimistic environment for investors seeking strategic entry points.
1. A Week in Review: Technical Bounce and Key Resistance
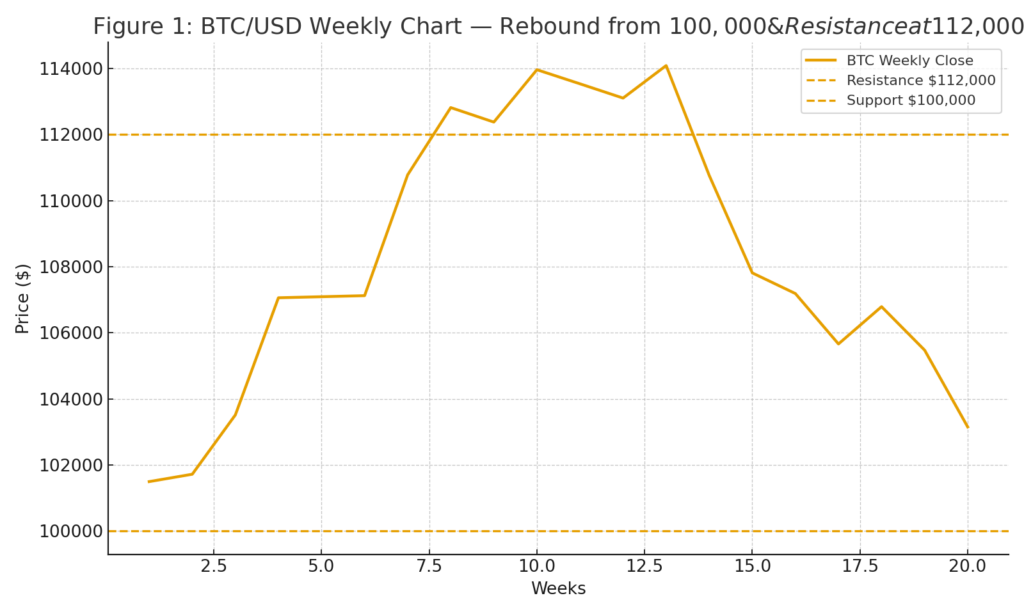
Bitcoin (BTC) modestly recovered into the $111,000 range, signaling a potentially promising reversal ahead of the weekly close, according to Cointelegraph’s recent report. Intraday, BTC/USD climbed roughly 1%, briefly reaching a local high of $111,369, as bulls defended the $111,000 support level.
Analyst and entrepreneur Michael van de Poppe tweeted that maintaining higher lows and protecting the $111,000 zone are constructive. He noted that breaking through $112,000 could mark a genuine resumption of the bull market.
However, trader sentiment is mixed. Cipher X warned that failure to reclaim $112,000 might lead to new lows, while Crypto Tony asserted that only a move above $113,000 would confirm an ascent; otherwise, a slide to $100,000 could follow.
Technical watchers point to key moving averages: 50-day MA at $115,035 and 200-day MA at $101,760. TurboBullCapital suggested that a dip below $107,000 could target near $101,000—aligning with the 200-day average and a potential bounce zone.
2. Fibonacci Perspective: Limiting the Downside
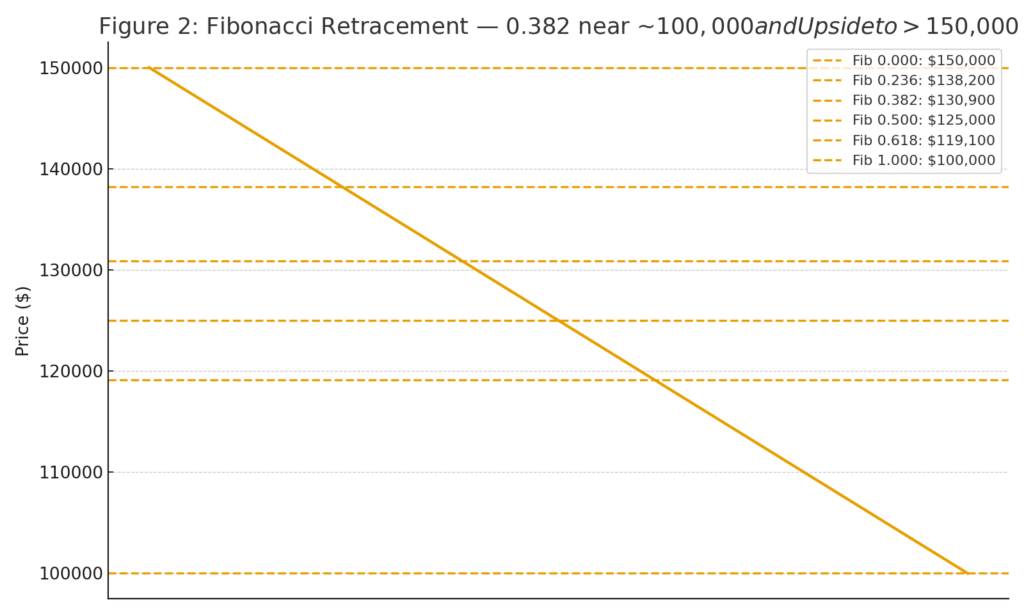
In a longer-term view, Fibonacci retracement analysis suggests a maximum correction of about 10%, which would trail to near $100,000—the 0.382 Fibonacci level seen as a historically stable bottom in Q3 2024 and Q2 2025.
Trader ZYN emphasized that if downside plays out as expected, a 50% rally could follow, possibly carrying BTC well above $150,000 in the ensuing bullish expansion.
Cointelegraph also explored market-maker dynamics using order book data; shorts could be squeezed, fueling powerful upside rallies like those seen in late 2024.
3. Strength Beneath the Surface: Supply in Profit Movement
According to a recent analysis, BTC was trading at $111,600, just below resistance near $112,500. The rebound from $108,000 indicated renewed strength. Moreover, on-chain data shows only ~13.71% of circulating supply is currently in loss—well under the 50% thresholds typical of weaker bear cycles. This suggests market confidence and a robust foundation.
4. Additional Market Data and Structural Signals
Other sources affirm this cautious optimism. Binance’s newsletter highlights that the $100,000 mark serves as both a technical and psychological floor, matching the Fibonacci 0.382 level. Should a correction end there, the outlook includes a potential 50% rally above $150,000.
Separately, CoinDesk reports rising pressure beneath key cost bases—specifically, 1-month and 3-month realized prices below ~$115,300 and $113,700, respectively. However, the 6-month cost basis ($107,440) remains supportive.
In another technical take, CryptoDnes underscores that while long-term weekly structure remains intact with bullish MA positioning, short-term daily charts are approaching a death-cross territory. Still, the RSI shows potential for a near-term rebound.
5. Visual Aids (Insert Here as Images)
(Insert Figure 1: BTC/USD Weekly Chart showing bounce from $100,000 and resistance at $112,000 )
(Insert Figure 2: Fibonacci Retracement overlay chart with 0.382 level at ~ $100,000 and potential upside to > $150,000)
(Insert Figure 3: On-chain Profit/Loss supply pie-chart highlighting ~13.7% in loss)
6. Strategic Implications for Investors and Practitioners
For cryptocurrency hunters, blockchain project developers, and strategists exploring new revenue flows:
- Entry Zones: The $100,000–$107,000 band may present lower-risk entry opportunities, aligning with Fibonacci and moving average support.
- Bull Breakout Trigger: A sustained move above $112,000–$113,000 could validate bullish momentum, perhaps triggering a rerun toward $150,000+.
- Risk Management: Prepare for temporary retreats—even if a full 10% correction occurs, structural health suggests eventual upward thrust.
- Beyond Speculation: For blockchain-based practical use cases (e.g., tokenization, DeFi, enterprise solutions), this environment offers both market signaling and development runway.
7. Summary and Outlook
Bitcoin’s recent rebound to around $111,300 has reinvigorated bullish hopes, contingent on reclaiming resistance near $112,000–$113,000. On-chain and technical indicators imply downside risks may be capped near $100,000, with solid foundations underpinning investor confidence. Should a correction end near Fibonacci support, the potential for a 50% rally looms large.
In the meantime, practitioners seeking value in both token innovation and blockchain utility should watch for consolidation in the $100K–$112K range. Clarity on macroeconomic trends and regulatory environment will further influence trajectory.
As always, this is not investment advice—conduct your own due diligence and risk assessment before acting.