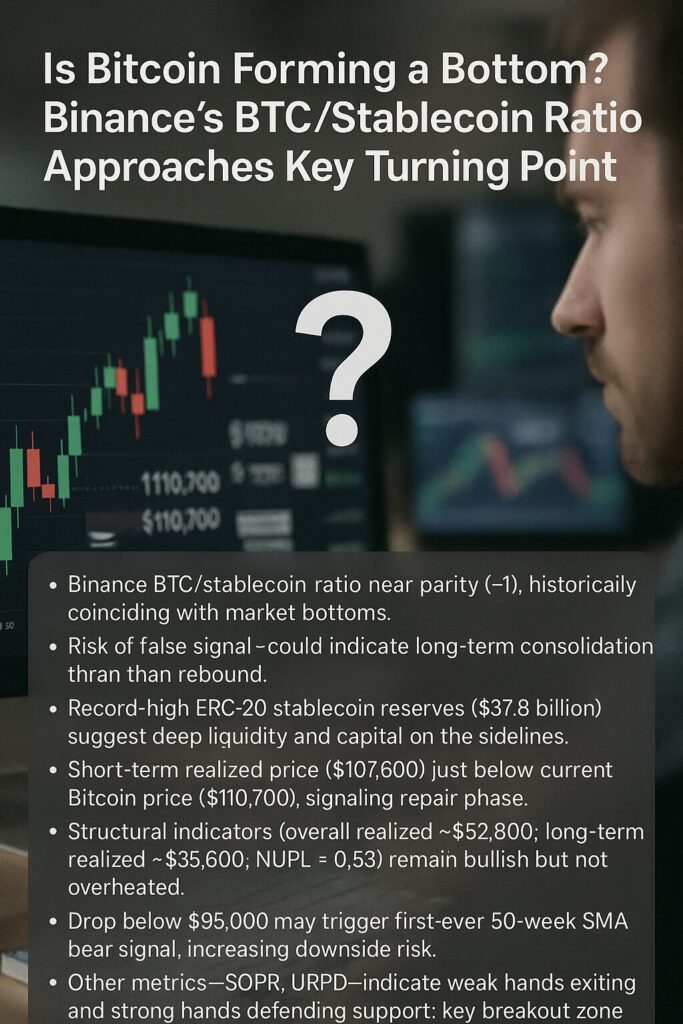
Key Points :
- Binance BTC/stablecoin ratio near parity (~1), historically coinciding with market bottoms.
- Risk of false signal—could indicate long-term consolidation rather than rebound.
- Record-high ERC-20 stablecoin reserves ($37.8 billion) suggest deep liquidity and capital on the sidelines.
- Short-term realized price ($110,700), signaling repair phase.
- Structural indicators (overall realized ~$52,800; long-term realized ~$35,600; NUPL = 0.53) remain bullish but not overheated.
- Drop below $95,000 may trigger first-ever 50-week SMA bear signal, increasing downside risk.
- Other metrics—SOPR, URPD—indicate weak hands exiting and strong hands defending support; key breakout zone lies between $113,500–$116,900.
1. Binance’s BTC/Stablecoin Ratio Near Parity: A Rare Buy Signal?
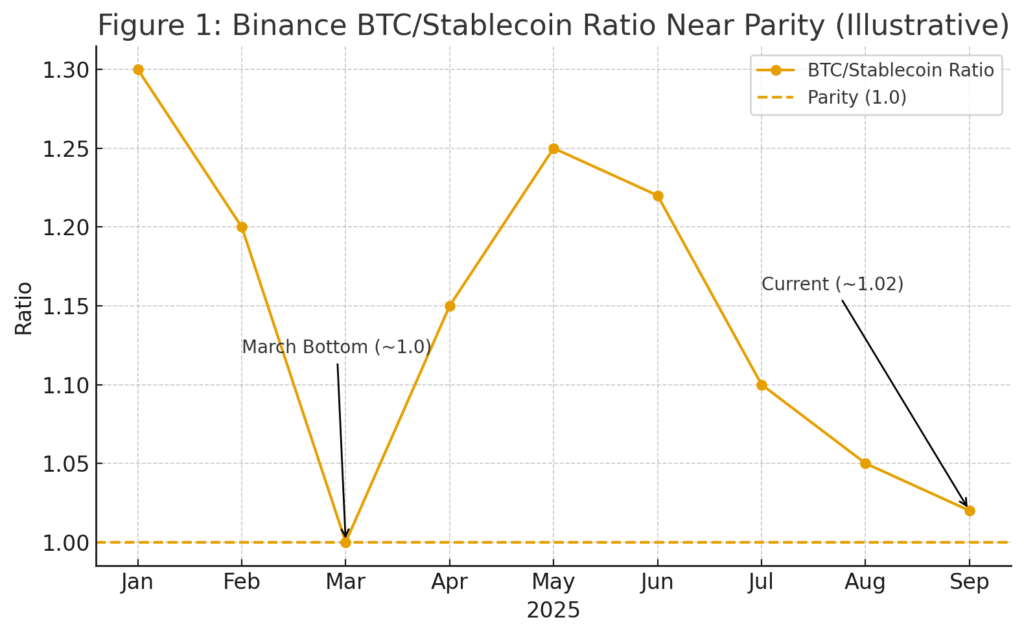
Binance’s ratio of Bitcoin reserves to stablecoin reserves is approaching parity at 1—a level that historically has preceded or coincided with market bottoms. The last occurrence in March saw Bitcoin retrace to approximately $78,000 before surging to an all-time high of around $123,000. This rare signal—having appeared only twice since the last bear market—is now flashing again, attracting attention as a potential bottoming indicator.
However, caution is needed: in prior cycles, similar signals emerged at the end of bear markets, but this could turn out to be a false bottom, instead marking the onset of a prolonged correction.
2. Record ERC-20 Stablecoin Reserves Signal Waiting Liquidity
Supporting the BTC/stablecoin ratio, Binance’s ERC-20 stablecoin reserves have reached a record $37.8 billion, signaling robust liquidity and potential buying power waiting on the sidelines. This suggests that while investors are not overexposed to BTC, sizeable funds are primed to enter the market.
3. Bitcoin Is in “Repair Phase” Above Short-Term Support
Bitcoin is currently trading near $110,700, slightly above the short-term holder realized price of $107,600—considered an important monthly bull support zone. According to researcher Axel Adler Jr., the market remains in a “repair phase”, emphasizing cautious optimism rather than exuberant bullishness.
4. Structural Indicators Remain Bullish, But Not Overheated
Despite short-term caution, long-term metrics are constructive:
- Overall realized price: $52,800
- Long-term holder realized price: $35,600
- Net Unrealized Profit/Loss (NUPL): 0.53 → Market broadly in profit, but not overheated.
This suggests that structurally the bullish trend endures, though the rally may remain range-bound while profit-taking is prevalent.
5. 50-Week SMA: Critical Bear Risk Threshold at $95,000
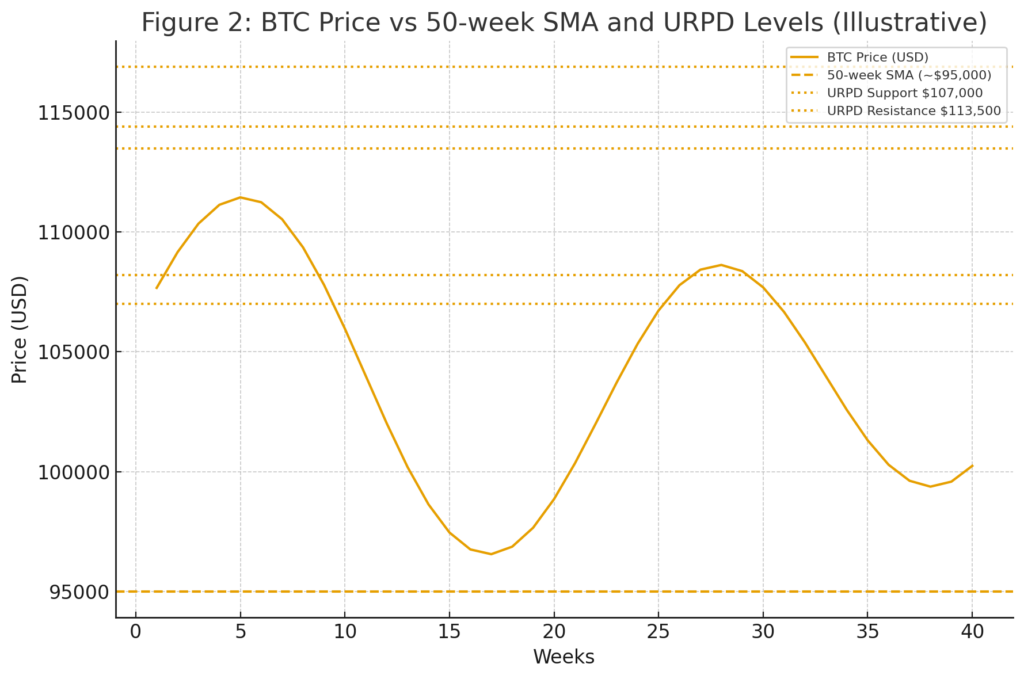
A decisive technical risk lies in Bitcoin’s relationship with its 50-week simple moving average (SMA). Historically, BTC closing the week below this SMA has triggered deep multi-month bear markets (e.g., –63 % in 2018, –67 % in 2022). If Bitcoin drops into the $90,000–$95,000 range and closes below the 50-week SMA, it may signal the first cycle bear market.
6. Other On-Chain Metrics: SOPR, URPD & Critical Zones
Further on-chain indicators strengthen the analysis:
- SOPR (short-term realized profit ratio) dropped to 0.982, indicating short-term sellers exiting at a loss—a potential sign of capitulation and possible accumulation by stronger hands.
- URPD (UTXO Realized Price Distribution) highlights strong support clusters at $107,000 (~286,000 BTC) and $108,200 (~447,500 BTC), reinforcing the market floor.
- Resistance resides in layers—$113,200–$113,500 (~210,700 BTC), $114,400, and a more formidable wall near $116,900 (~2.9 % of supply). Breaking above these layers is key for narrative shift toward bullishness.
Conclusion
Binance’s BTC/stablecoin ratio nearing parity is a rare and noteworthy signal, historically aligning with market bottoms. Coupled with record $37.8 billion stablecoin reserves, there is significant liquidity and buying power lurking at the sidelines. Bitcoin sitting above critical short-term realized price (~$107,600) suggests we may be in a repair phase rather than a full-fledged rally.
However, risks remain: A drop below $95,000 could trigger a 50-week SMA breakdown—the first ever—for this cycle, potentially heralding deeper correction. On-chain data (SOPR and URPD) show capitulation and support, but the path to renewed strength will require BTC to reclaim resistance zones between $113,500–$116,900.
For readers scanning for new crypto opportunities or seeking practical blockchain insights, the current environment teaches critical lessons: watch for volume-heavy liquidity signals, interpret them in the context of realized price & moving averages, and always assess whether signals are true reversals or deceptive traps. Patience, context, and structural understanding remain paramount.


