
Main Points :
- Ethereum (ETH) breaks above the $4,000 level for the first time since December 2024, signaling renewed bullish momentum.
- The breakout was driven by strong institutional demand, ETF inflows, short squeezes, and growing on-chain activity.
- Analysts foresee potential moves to $5,000 and beyond, fueled by regulatory clarity and institutional adoption.
- Market indicators suggest a shift from resistance to support around $4,000–4,150, laying the groundwork for a possible altcoin season.
- Ongoing macroeconomic catalysts, including stablecoin regulation and potential 401(k) inclusion, reinforce optimism.
1. A Major Technical Breakthrough
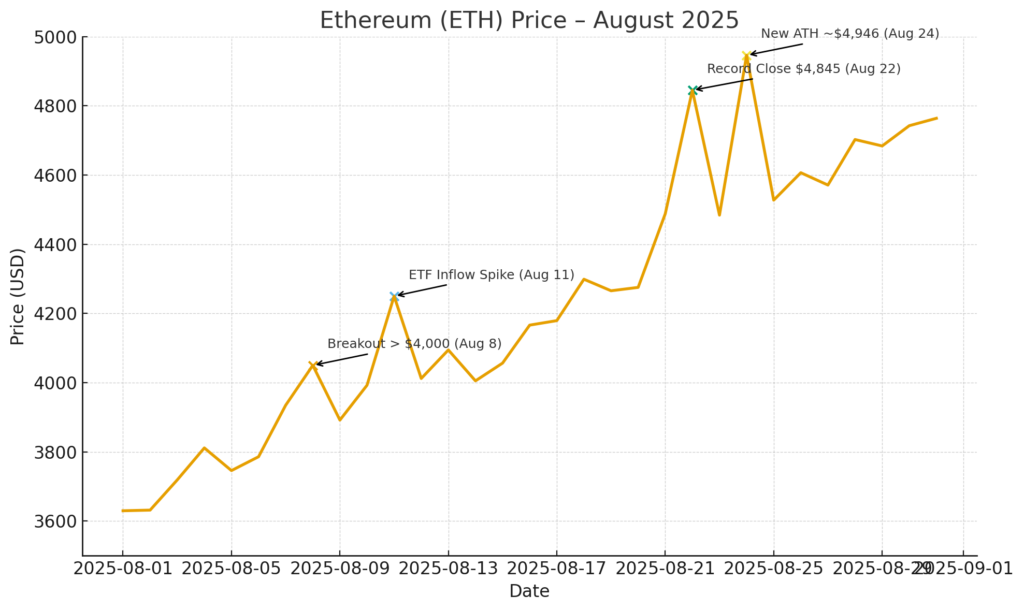
Ethereum’s ascent past the $4,000 threshold in early August marked a significant technical milestone. On August 8, 2025, ETH breached this key resistance level for the first time since December 2024 and traded at approximately $4,050. This movement signaled a potential shift in market sentiment and momentum for the leading smart‑contract platform.
2. Catalysts Behind the Rally
Institutional Buying & ETF Inflows
Massive inflows into U.S.-listed spot Ethereum ETFs—over $6.7 billion year-to-date—have played a central role in fueling ETH’s upward trajectory. On August 11 alone, inflows reached $1.02 billion; BlackRock’s ETHA accounted for more than half of total ETF holdings, underscoring its liquidity dominance.
Short Squeezes & Technical Momentum
Liquidation events accelerated the rally—CoinDesk reported around $207 million in short liquidations around the breakout. Plus500 echoed these findings, highlighting the role of short squeezes in complementing increased institutional accumulation and technical strength.
On-Chain Activity & DeFi Uptick
Ethereum’s usage metrics have picked up notably. Total Value Locked (TVL) in DeFi protocols returned to levels not seen since early 2022—surpassing $86 billion. On-chain transaction volumes and staking, driven by growing DeFi engagement, further reinforce ETH’s utility narrative.
3. Support Is Now Forming
Cointelegraph noted that ETH continues to gain ground in market cap dominance as Bitcoin’s share shrinks. Technical analysis indicates a new support zone forming between $4,000 and $4,150, a region that was previously stiff resistance. Analyst “Demi‑Defi” stated that as long as weekly closes stay above this range, dips could be viewed as consolidations, while a close above $4,550 might open the way to new all‑time highs.
4. Forecasts: $5,000… $10,000… Even $20,000?
Bullish Price Projections
Following the breakout, bulls are projecting further gains—some are targeting $5,000 as the next logical level. CryptoPotato reports that ETH’s surge cleared the 2021 highs and wiped out most of the 2025 drawdowns, placing it in a strong position for fresh records.
Regulatory & Fundamental Tailwinds
The passage of the U.S. GENIUS Act, establishing a federal stablecoin framework, is seen as a key catalyst. Analysts argue this legislative clarity will channel trillions into Ethereum’s ecosystem, given its dominant role in stablecoin issuance. Similarly, if retirement accounts begin accepting crypto within 401(k) plans, projections estimate up to $125 billion in new inflows.
In parallel, broader-market optimism is supported: ETH is up around 45% year-to-date by mid‑August, outpacing Bitcoin’s 25% gain. On August 24, Ethereum even dashed past its previous all‑time high by climbing to $4,945.60, nearing a $600 billion market cap.
5. What’s Next for ETH and the Broader Crypto Space
The recent volatility following Fed Chair Powell’s Jackson Hole speech underscores sensitivity in crypto markets. Ethereum briefly reached $4,954 before retreating to around $4,400 amid a “flash crash” that triggered nearly $300 million in ETH liquidations. Still, long-term sentiment remains constructive, buoyed by sustained ETF inflows and treasury-level adoption.
Ether’s record-closing high of $4,845 on August 22, followed by a peak of $4,882 intra-day, reflects the continued strength of its bullish case. Added to that, institutions and developers increasingly view Ethereum’s smart‑contract capabilities as central to the future of digital finance.[Insert Graph Here]
Placement Suggestion: After Section 2 (“Catalysts Behind the Rally”), insert a chart illustrating ETH’s price trajectory from $3,500 to nearly $5,000 over August 2025. The chart should highlight key milestones: breakout at $4,000, ETF inflow spikes, and new all-time highs.
Conclusion: Ethereum at a Crossroads
Ethereum’s breach of the $4,000 mark has reignited market interest, driven by a powerful combination of institutional capital, ETF flows, technical momentum, and growing on-chain utility. With regulatory developments and macro tailwinds strengthening its foundation, ETH is firmly on bullish terrain.
While short-term pullbacks—like those following Jackson Hole—remind us of crypto’s volatility, the structural trends point toward upside. If support at $4,000–4,150 holds and institutional confidence continues, Ethereum may well be setting the stage for a new all-time high. For investors exploring fresh crypto opportunities, ETH’s momentum offers both excitement and potential—but prudent vigilance remains key.