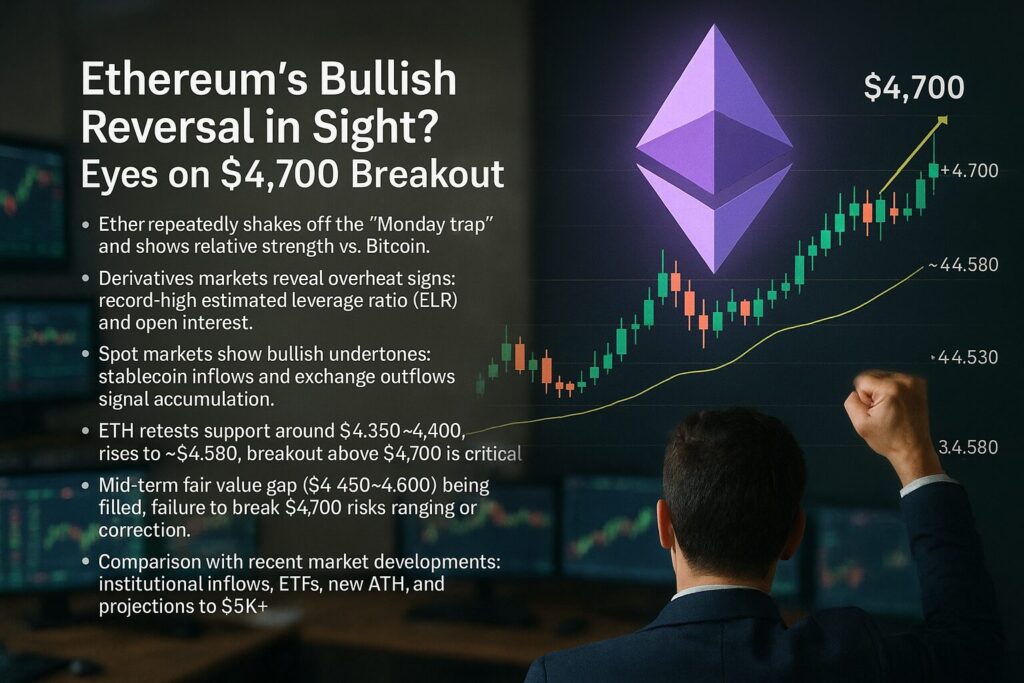
Main Points :
- Ether repeatedly shakes off the “Monday trap” and shows relative strength vs. Bitcoin.
- Derivatives markets reveal overheat signs: record-high estimated leverage ratio (ELR) and open interest.
- Spot markets show bullish undertones: stablecoin inflows and exchange outflows signal accumulation.
- ETH retests support around $4,350–4,400, rises to ~$4,580; breakout above $4,700 is critical.
- Mid‑term fair value gap ($4,450–4,600) being filled; failure to break $4,700 risks ranging or correction.
- Comparison with recent market developments: institutional inflows, ETFs, new ATH, and projections to $5K+.
Introduction
Ethereum’s (ETH) recent price action suggests a turning of the tide, as it shakes off the notorious “Monday trap”—where leveraged weekend long positions are forced to liquidate at the start of the week—and reasserts strength relative to Bitcoin. On Tuesday of the analyzed week, ETH jumped by up to 5 %, while Bitcoin managed only a 1 % gain. This rebound, however, comes amid mixed signals: derivatives markets signal overheating, while spot activity reflects genuine accumulation. The critical level to watch is $4,700—a clean breakout above it, with daily close, could herald a renewed bullish leg toward $5,000, whereas a failure may lock ETH in the $4,350–$4,700 range, or open risk of deeper correction toward $4,000.
1. Shaking Off the “Monday Trap”: ETH vs. BTC Strength
Ethereum repeatedly combats the so-called “Monday trap”—a pattern where bullish weekend sentiment and buildup of leveraged long positions collapse at the start of the week due to mass liquidations. Data shows that during previous crashes in April and June, over 300,000 ETH longs were liquidated in a single day, indicating Monday as the peak for liquidation volume. In this recent cycle, ETH avoided a weak open and instead rallied strongly: Tuesday’s move delivered a near‑5 % gain, versus barely 1 % for BTC, marking a relative show of strength.
This outperformance suggests robust short-term demand and confidence among buyers—a favorable sign for Ethereum’s resilience.
2. Derivatives Market: Overheat Signals
Despite the rebound in spot trading, derivatives markets raise red flags. The estimated leverage ratio (ELR) on Binance—a proxy for traders’ leverage—spiked to 0.53, a sizable leap from the mid‑2020 figure of 0.09. A rising ELR indicates elevated optimism and elevated liquidation risk. Moreover, open interest in ETH derivatives peaked at a historic high around $70 billion as of August 22.
These metrics warn that excessive positioning may leave markets vulnerable to sharp unwinds should sentiment pivot.
3. Spot Market Dynamics: Bullish Underpinnings
Contrastively, spot market indicators lend support to a bullish narrative. Analyst Amr Taha noted more than $1.65 billion in stablecoins flowed into Binance—marking the second such surplus in August. Concurrently, withdrawals of roughly 208,000 ETH (approximately $1 billion) from Binance to cold wallets occurred over August 24–25. This movement away from exchanges typically suggests reduced selling pressure and long-term intent by holders.
Institutional or long-hold appetite appears mounting, even as leveraged activity overheats—creating a finely balanced environment.
4. Technical Watch: Reclaiming and Breaking $4,700
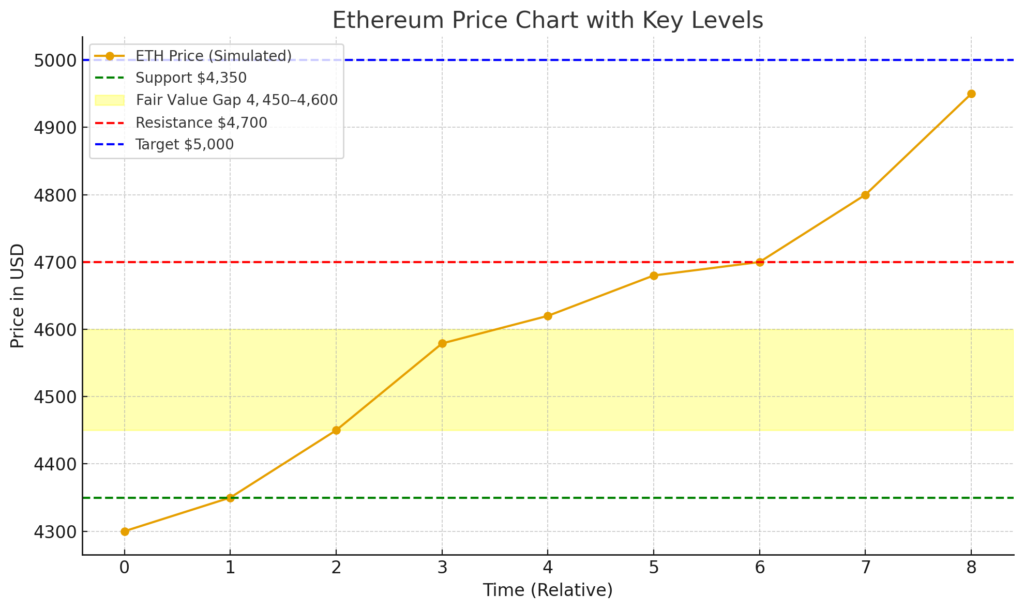
Technically, ETH retested long-term support around $4,350 and absorbed liquidity from daily order blocks before rising to $4,579. The mid-term chart reveals a fair value gap between $4,450–$4,600 that is being filled. If bulls can lift ETH above $4,662 and decisively close above $4,700, multiple timeframes would align favorably, clearing the path toward $5,000. If not, a short-covering bounce could reverse as sellers re-enter near recent highs. A break below $4,350 would raise the risk of deeper correction.Insert Chart Here (around this sentence)
[ $4,350 support, $4,450–4,600 fair value gap, $4,700 resistance, and path toward $5,000.]
5. Broader Market Context: Institutional Inflows and ATH
Recent developments reinforce the bullish thesis:
- New All-Time Highs: Ethereum surged to a fresh ATH approaching $4,953 on August 23–24, driving market cap toward $600 billion.
- Institutional Endorsement: Billionaire investor Peter Thiel and Founders Fund ramped up investments in ETH-backed firms and tokens; ETF inflows, growing stablecoin issuance, and tokenization of financial products underpinned broader interest.
- Regulatory Tailwinds: Policies such as the GENIUS Act in the U.S. catalyzed confidence in stablecoins and Ethereum’s infrastructure role; Ethereum gained 54 % in the past month outperforming BTC.
- Bullish Forecasts: Standard Chartered projects ETH could reach $7,500 by end‑2025, with longer-term targets of $12,000 (2026) and $18,000 (2027).
These elements suggest that the broader narrative supports ETH’s structural case, especially if technicals line up.
Summary & Outlook
Ethereum is at an inflection point. Its ability to shrug off “Monday trap” liquidations and realign in the spot and derivatives markets signals a potential turning point. However, elevated leverage and open interest caution against complacency.
The next critical test lies at $4,700. A sustained close above this level will likely unlock bullish momentum toward $5,000 and potentially beyond. But failure to breach, or a break below support zones (especially $4,350), could see ETH capped by sellers or slipping into a deeper correction.