
Main Points:
- Bitcoin has rebounded from its 50-day SMA around $112,619 and is testing resistance at the 20-day SMA near $116,804, with potential to challenge $120,000 and all-time highs if it holds above.
- Ethereum remains above its 20-day SMA near $3,675, facing key resistance at $3,745; a clear break could push it toward $4,094, but a drop below $3,300 would invalidate the bullish case.
- XRP continues to oscillate between its 50-day SMA ($2.69) and 20-day SMA ($3.16), awaiting a decisive move; a break above $3.33 could signal renewed momentum, while a fall below $2.69 risks a drop to $2.40.
- Solana shows a neutral trend, trading around its 50-day SMA ($162) with RSI in the mid-50s; a rebound could see $178–$185, but a break below $155 could send it toward $137.
- Recent institutional flows have been a key driver: Bitcoin saw record ETF inflows of $12.8 billion in July, yet experienced $196 million outflows on August 5, indicating mixed sentiment.
- Market developments: MicroStrategy’s $2.46 billion Bitcoin purchase at an average $117,256 reinforces long-term treasury demand; Ethereum’s Shanghai upgrade and growing DeFi activity underpin bullish narratives; XRP’s ongoing legal clarity continues to shape investor outlook; Solana’s NFT and ecosystem growth signal potential catalysts.
1. Bitcoin Price Analysis and Outlook
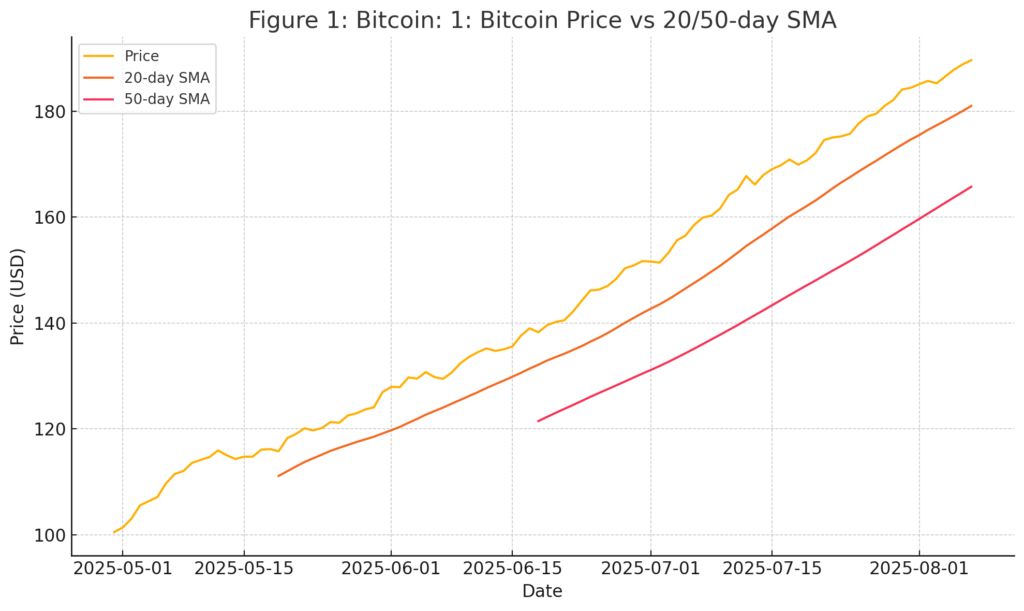
Bitcoin’s recent price action shows a strong rebound from the 50-day simple moving average (SMA) at approximately $112,619, demonstrating that buyers are defending this level vigorously. As of August 7, 2025, BTC traded near $114,973, up modestly on the day. The immediate resistance lies at the descending 20-day SMA around $116,804.
- Bullish scenario: A decisive break and daily close above the 20-day SMA would likely see Bitcoin challenge the $120,000 resistance zone, with the next target at the all-time high of $123,218. Robust institutional demand—evident in July’s record $12.8 billion ETF inflows—could underpin such a move.
- Bearish scenario: If BTC fails at the 20-day SMA and dips below the 50-day SMA at $112,619, sellers may push it down to $105,000, and potentially to $100,000. A break beneath the immediate support at $110,530 would further confirm weakness.
Chart Insertion (Figure 1):
Insert Bitcoin price vs. 20/50-day SMA here:
2. Ethereum Price Analysis and Outlook
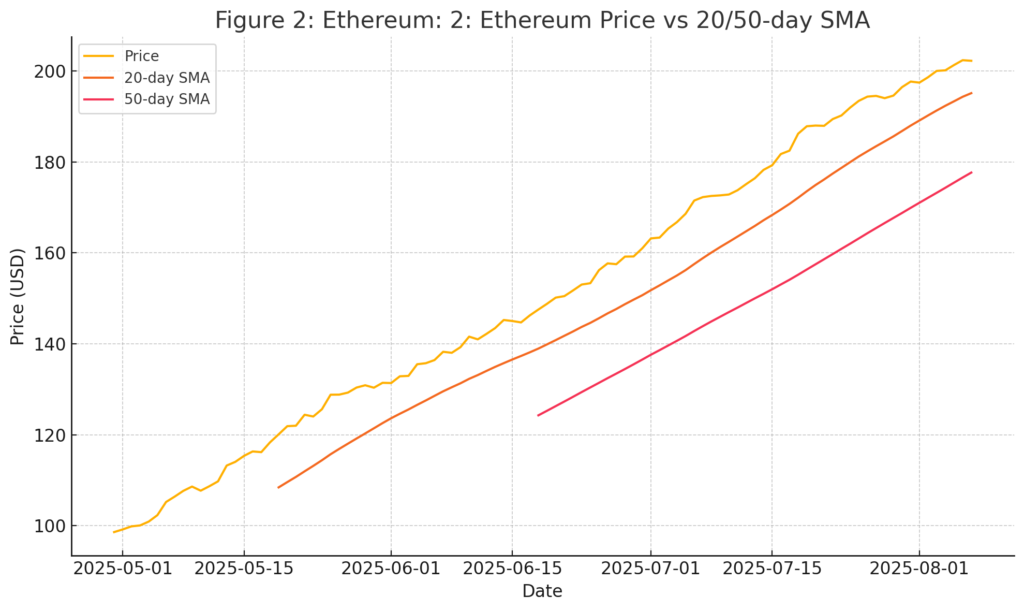
Ethereum has traded above its 20-day SMA (currently $3,675) since August 4, but stalled at $3,745 resistance, indicating profit-taking at higher levels. The uptrend remains intact as long as ETH stays above the 20-day SMA.
- Bullish scenario: A clean break above $3,745 could propel ETH toward $3,941 and eventually $4,094, driven by positive catalysts such as the Shanghai upgrade’s staking unlocks and growing DeFi TVL.
- Bearish scenario: A drop below the 61.8% Fibonacci retracement of the recent rally at $3,300 would invalidate the bullish setup, opening the door to a test of the 50-day SMA at $3,058.
Chart Insertion (Figure 2):
Insert Ethereum price vs. 20/50-day SMA here:
3. XRP Price Analysis and Outlook
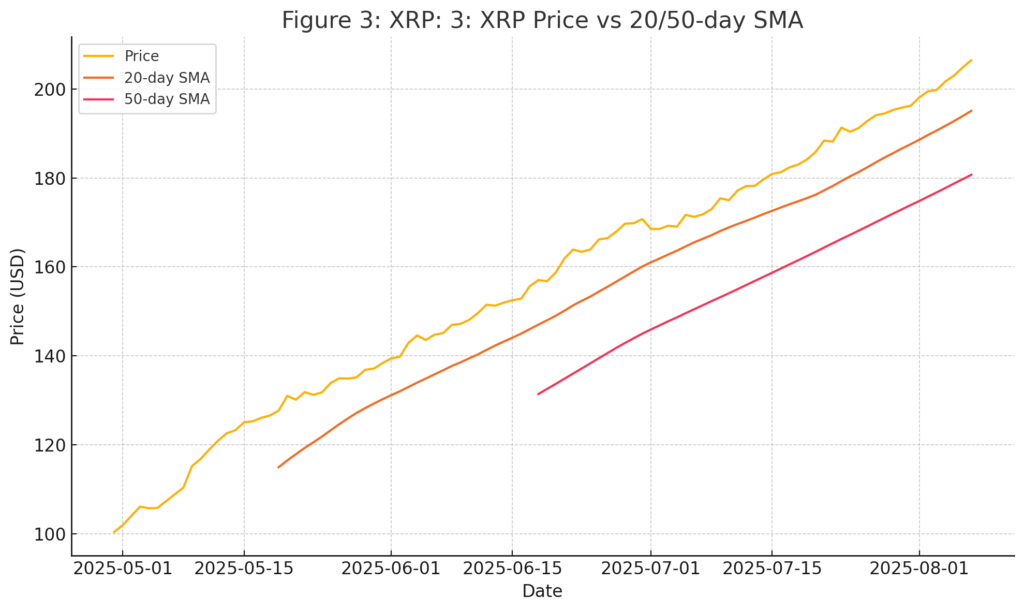
XRP’s price action reflects a tug-of-war between bulls and bears as it bounces off the 50-day SMA ($2.69) but struggles near the 20-day SMA ($3.16). This “buy-the-dip, sell-the-rally” pattern suggests consolidation between these moving averages.
- Bullish scenario: A break above the 20-day SMA and sustained close could signal the end of the corrective phase, targeting $3.33 and then $3.66. Positive developments in Ripple’s legal case could add fuel.
- Bearish scenario: A drop below the 50-day SMA would signal bearish dominance, risking a slide to $2.40.
Chart Insertion (Figure 3):
Insert XRP price vs. 20/50-day SMA here:
4. Solana Price Analysis and Outlook
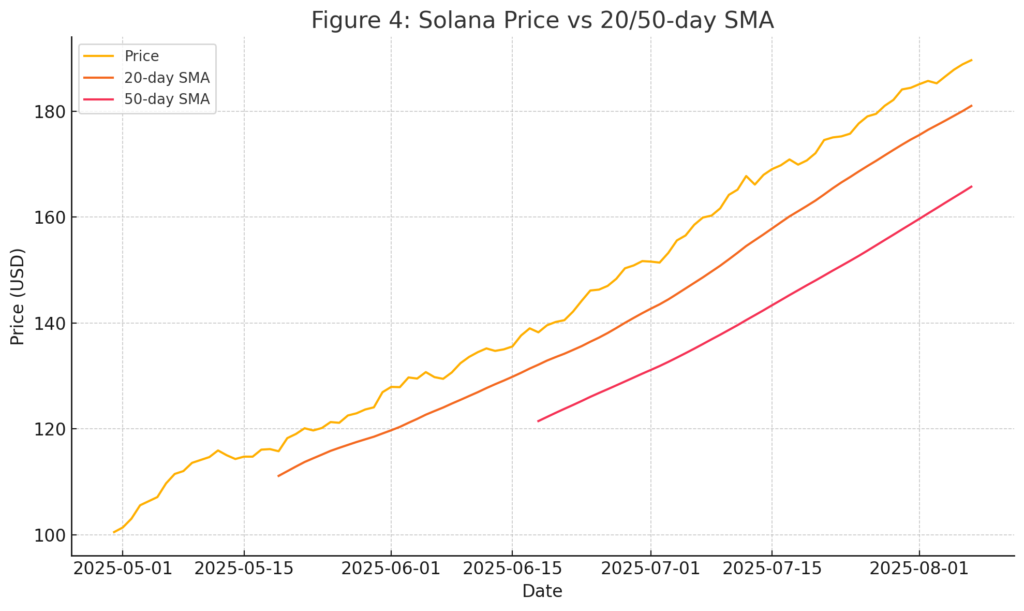
Solana is trading at roughly $162, right at its 50-day SMA, with both the moving averages and RSI showing neutral bias. Recent weakness on rallies has kept SOL range-bound.
- Bullish scenario: A sharp rebound off the 50-day SMA could push SOL to the 20-day SMA near $178. A break above $185 would tilt the advantage to bulls and aim for the $209 resistance.
- Bearish scenario: A failure to hold $155 could accelerate losses toward $144, and potentially $137, as selling intensifies. Growth in Solana’s NFT and DeFi ecosystem could serve as a catalyst for upside if positive network metrics continue.
Chart Insertion (Figure 4):
Insert Solana price vs. 20/50-day SMA here:
Conclusion
Overall, the crypto market stands at a critical juncture. Bitcoin’s ability to sustain above its 50-day SMA and break the 20-day SMA will determine if it can push toward new highs, supported by robust institutional inflows and corporate treasury adoption. Ethereum’s bull case hinges on clearing $3,745, while XRP and Solana await decisive technical triggers. Investors seeking new assets and practical blockchain applications should watch moving-average levels, institutional flow data, and key ecosystem developments closely to identify the next breakout opportunities.