
Main Points:
- Bitcoin reached an all-time high of $123,218, then retraced on profit-taking.
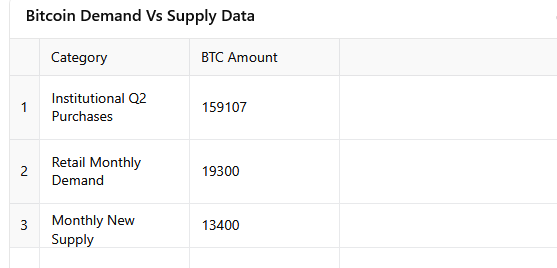
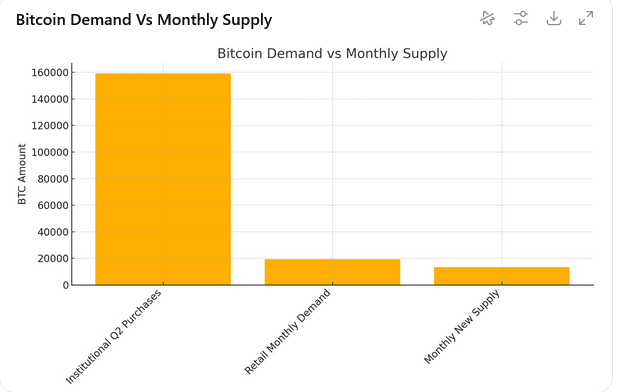
- Institutional buyers scooped up 159,107 BTC in Q2 2025, underscoring strong demand.
- Retail “shrimp,” “club,” and “fish” holders bought 19,300 BTC in May 2025, outpacing new monthly supply (~13,400 BTC).
- Technicals suggest a possible dip toward $113,000 (inverse head-and-shoulders neckline) before a rally.
- A sustained break above $123,218 would open the door to $150,000; a drop below the 20-day EMA ($107,794).
Post-All-Time High Pullback
Bitcoin’s swift ascent to a fresh all-time high of $123,218 was met by profit-taking, causing the price to pare gains. Such pullbacks are typical after parabolic runs and are viewed by many analysts as technical adjustments rather than signs of weakening fundamentals. Overall demand, fueled by both institutional and retail participants, remains robust, setting the stage for the next potential leg higher toward $150,000.
Institutional and Retail Demand Remains Strong
Institutional investors continued to accumulate aggressively. According to BitcoinTreasuries.NET, corporate entities purchased a total of 159,107 BTC in Q2 2025. Meanwhile, Bitfinex data shows that retail cohorts—classified by holdings as shrimps (<1 BTC), clubs (1–10 BTC), and fish (10–100 BTC)—bought 19,300 BTC in May alone, substantially exceeding the estimated monthly supply of 13,400 BTC post-April 2024 halving.
The disparity between demand and supply underscores a continued bullish undercurrent. Even after the recent retracement, both cohorts are poised to support higher price levels.
Technical Analysis: Daily Chart Perspective
On the daily timeframe, Bitcoin is currently testing the neckline of an inverse head-and-shoulders pattern near $113,000. If the price finds support at this zone—or at the rising 20-day EMA (around $112,390)—buyers may step in to challenge the $123,218 high once more. A successful breakout above that high would confirm the pattern, projecting a target toward $150,000.
Conversely, a drop and close below the 20-day EMA would signal fading momentum. In that scenario, the next key support lies near the 50-day SMA at $107,794, offering a deeper—but structurally healthy—retracement.
Technical Analysis: 4-Hour Chart Perspective
Zooming into the 4-hour chart reveals short-term weakness: Bitcoin has slipped below its 20-period EMA, indicating bearish pressure in the near term. If attempts to rebound from the current level fail around the 20-EMA, a swift decline toward the inverse head-and-shoulders neckline at approximately $110,530 could materialize.
However, should the price bounce at this critical support zone and recapture the 20-period EMA, bulls may regain control. That would pave the way back toward $123,218, reaffirming the medium-term uptrend.
Potential Scenarios: Upside to $150,000 and Support Levels
- Bullish Scenario:
- Price holds the $113,000–$110,530 support zone.
- Rejection at 20-period EMAs flips into support.
- Break above $123,218 unleashes a move to $150,000.
- Bearish Scenario:
- Sustained close below $112,390 (20-day EMA).
- Next support at $107,794 (50-day SMA).
- Further dip to $105,000 if $107,794 fails, extending the correction.
Emerging Trends and Market Drivers
- ETFs and ETFs on the Horizon: Recent filings for spot Bitcoin ETFs in the U.S. have kept institutions engaged, with approval expected later in 2025.
- Layer-2 Expansion: Growth in Lightning Network adoption and upcoming Ethereum scaling updates have drawn fresh capital into BTC and ETH, diversifying yield opportunities.
- Macro Tailwinds: A dovish Fed stance and concerns over traditional asset valuations continue to push allocators toward digital gold.
- On-chain Metrics: Active addresses and network fees are rising, signaling increased usage and interest.
Conclusion
Bitcoin’s retracement from $123,218 is a natural cooldown within a broader bull market. Strong institutional and retail demand, illustrated by record Q2 purchases and retail buying outpacing new supply, provides a solid foundation for the next rally. Technically, a hold above $113,000 and a rebound off the EMAs will likely set the stage for a move toward $150,000. Conversely, failure to defend key moving averages could deepen the correction but ultimately create a sturdier base for future gains. Market participants should monitor on-chain demand, ETF developments, and macroeconomic signals to gauge the timing of the next leg up.