Main Points:
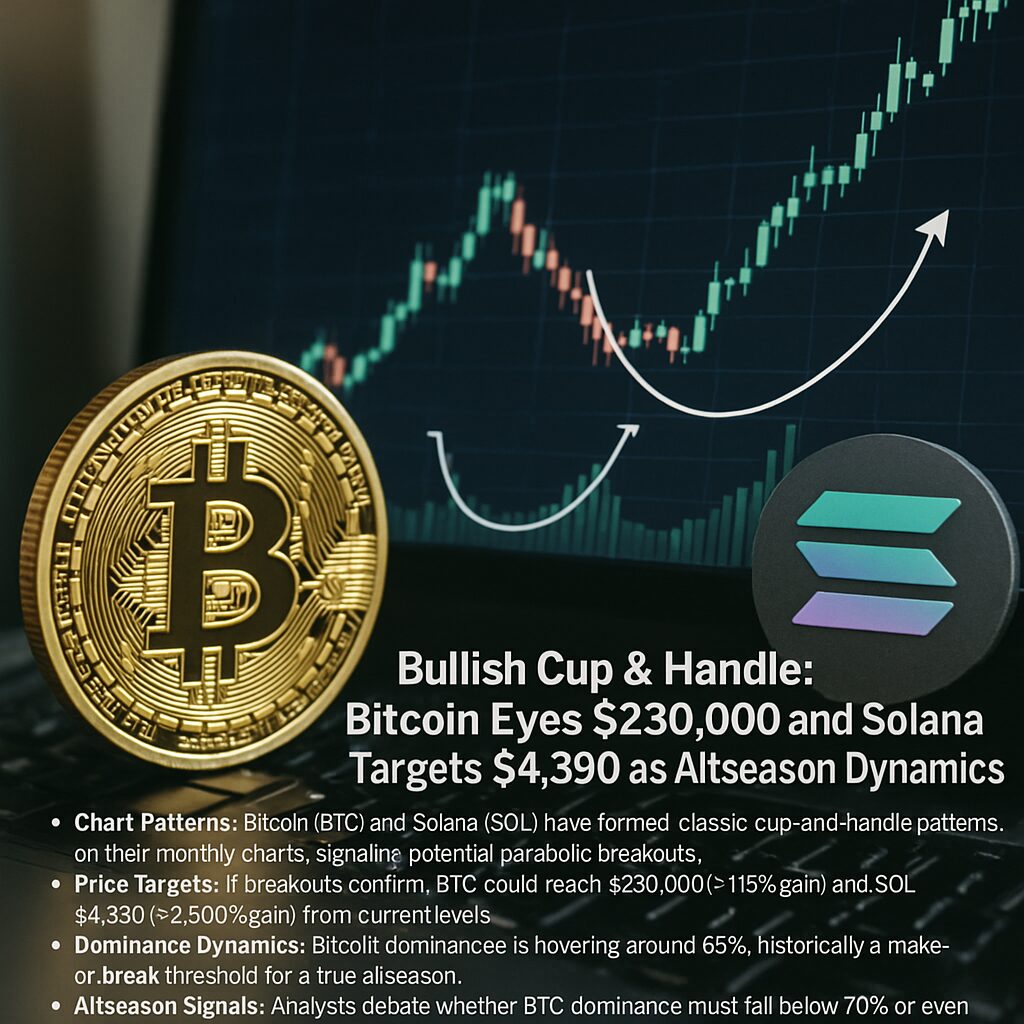
- Chart Patterns: Bitcoin (BTC) and Solana (SOL) have formed classic cup-and-handle patterns on their monthly charts, signaling potential parabolic breakouts.
- Price Targets: If breakouts confirm, BTC could reach $230,000 (≈115% gain) and SOL $4,390 (≈2,800% gain) from current levels.
- Dominance Dynamics: Bitcoin dominance is hovering around 65%, historically a make-or-break threshold for a true altseason.
- Altseason Signals: Analysts debate whether BTC dominance must fall below 70% or even 56% to catalyze an altcoin surge.
- Investor Strategies: Traders should watch breakout confirmations, rotation of capital into altcoins, and emerging fundamentals for new high-beta plays.
1. The Cup & Handle Technical Setup
The cup-and-handle is a bullish continuation pattern characterized by a rounded trough (“cup”) followed by a smaller consolidation (“handle”) that resembles a flag. When price breaks above the handle’s resistance, a strong upward move often follows.
- Formation on BTC and SOL: Popular analyst “Trader Alan” highlighted that both BTC and SOL have completed the cup portion and, in monthly chart data, BTC has already broken above the handle while SOL is still testing resistance.
- Psychology: The cup reflects an extended period of value recovery back to prior all-time highs, while the handle represents profit-taking and consolidation before renewed buying. A breakout signals the market’s confidence to push beyond previous peaks.
- Historical Precedent: In 2021–2022, BTC formed a similar pattern, rallying from a post-LUNA crash trough back to its $69,000 highs, reinforcing the pattern’s reliability.
2. Bitcoin’s Path to $230,000
Bitcoin’s monthly chart suggests a breakout target near $230,000, which equates to roughly a 115% increase from current price levels around $106,000.
Technical Rationale
- Breakout Confirmation: BTC’s handle breakout occurred in early July 2025, with volume expanding on the upside—an essential element for validating the move.
- Measured Move: The height of the cup—from trough (
$16,000) to neckline ($69,000)—implies a target of $69,000 + ($69,000 – $16,000) = $122,000 measured move above the breakout point, which projects to ≈$230,000. - Market Momentum: Since Bitcoin’s March 2024 crash low, BTC has posted higher lows, indicating a sustained uptrend gathering steam.
Macro Catalysts
- Institutional Interest: Continued inflows into Bitcoin ETFs in the U.S. have added billions in new capital, supporting higher price floors.
- Regulatory Clarity: Favorable guidance from the SEC on crypto derivatives and spot ETFs has reduced uncertainty and bolstered long-term confidence.
3. Solana’s Ambitious 2,800% Upside
Solana currently trades near $150 but, if it completes its cup-and-handle breakout, could surge to $4,390, requiring an astounding 2,800% rally.
Technical Rationale
- Cup Completion: SOL’s cup spans from the March 2022 low (
$10) up to its all-time high ($294), forming a wide U-shape over more than two years. - Handle Formation: Since January 2025, SOL has oscillated between $100–$200, carving out the handle consolidation necessary for a fresh upward thrust.
- Breakout Level: A break above $294 on strong volume would signal the start of the measured move: $294 + ($294 – $10) ≈ $578. But analysts like Trader Alan argue for an extended parabolic scenario targeting $4,390, assuming a broader market pullback in BTC dominance and reinvestment into high-beta altcoins.
Fundamental Drivers
- Ecosystem Growth: Solana’s high-speed, low-fee blockchain continues to onboard new DeFi protocols and NFT platforms, boosting on-chain activity.
- Developer Incentives: Initiatives like the Solana Foundation’s grants and token unlock schedules are expected to release further demand pressures.
- Institutional Adoption: Major custodians are adding SOL to their product suites, opening the token to pension funds and endowments.
4. The Role of Bitcoin Dominance in Shaping Altseason
Bitcoin dominance—the share of total crypto market cap held by BTC—is currently at 65%, near levels not seen since early 2021. Its trajectory often dictates when altcoins can outperform.
- Historical Patterns: In past cycles, altseasons began when BTC dominance peaked around 70% and then retraced, allowing capital to flow into altcoins.
- Threshold Debates: Analyst “Rekt Capital” suggests altseasons might start even without a 70% peak, pointing to cycle-specific dynamics this time around.
- Dominance Indicators: A drop below 56% is a strong bullish signal for altcoins, as per CoinGecko data, whereas remaining above 60% may constrain alts.
Current Sentiment
- Capital Rotation: Despite BTC’s strength, trading volume in top altcoins like ETH, BNB, and ADA has begun rising, hinting at early rotation.
- Media Focus: Coverage of blue-chip alts is increasing, but true altseason breadth—measured by small-cap performance—remains muted.
5. Market Sentiment and Macro Factors
Macro Environment
- Inflation and Rates: As U.S. Federal Reserve policy shows signs of plateauing rate hikes, risk assets including crypto find support.
- Geopolitical Stability: Reduced tensions in major markets have improved risk appetite, benefiting higher-beta assets like SOL.
Sentiment Metrics
- Fear & Greed Index: Currently in “Greed” territory, reflecting bullish positioning among retail participants.
- On-Chain Flows: Exchange inflows for BTC have decreased, suggesting hodling behavior; altcoin inflows remain steady, indicating distribution phases.
Emerging Trends
- Layer-2 Adoption: Ethereum L2s (Arbitrum, Optimism) attract capital, indirectly impacting ETH and altseason readiness.
- AI and Web3: Tokens linked to AI integration (e.g., SingularityNET) and decentralized data oracles (e.g., Chainlink) are drawing early interest.
6. Strategies for Traders and Investors
- Confirmation First: Wait for monthly candlestick closes above cup-and-handle resistance before entering large positions.
- Scale In: Use dollar-cost averaging to build positions in both BTC and high-beta alts like SOL as technical levels confirm.
- Monitor Dominance: If BTC dominance falls below 60%, consider rotating up to 5–10% of portfolio into mid-cap alts.
- Hedge with ETH: Maintain a hedge by holding Ethereum or stablecoin positions in case BTC retraces before altseason.
- Stay Informed: Track on-chain metrics and newsflow around regulations, ETF approvals, and major corporate adoptions.
Conclusion
The cup-and-handle formations on Bitcoin and Solana monthly charts paint a compelling bullish narrative, with breakout targets of $230,000 for BTC and $4,390 for SOL. However, the true catalyst for Solana’s parabolic move hinges on a decisive shift in Bitcoin dominance and the onset of a robust altseason. Traders should balance technical confirmation with macro and on-chain indicators, scaling into positions methodically and hedging appropriately. As institutional adoption strengthens and regulatory clarity improves, the coming months may usher in one of the most exciting phases yet in cryptocurrency markets.