
Main Points:
- Long-term holders have realized substantial profits—$849 million from coins held 3–5 years, $485 million from 7–10-year coins, and $445 million from 1–2-year coins—yet BTC’s price remains stable, indicating strong absorption of sell pressure.
- On-chain metrics like Spent Output Age Bands and Binary Coin Days Destroyed suggest healthy rotation from seasoned investors to newer market participants, a typical mid- to late-bull-cycle dynamic.
- Historically, July is Bitcoin’s strongest month, averaging a 7.56 % return since 2013, with a 24.03 % surge in July 2020 and only four down-months—pointing to a seasonal tailwind.
- Bitcoin’s correlation with the S&P 500, which closed at a June monthly high, further supports the possibility of new highs above $112,000 this month.
- Technical analysis by CryptoCon highlights a 195-day range expansion since December 18, 2024, with just 36 days of notable price moves, framing the current sideways action as a prelude to a breakout.
1. Realized Profit Surge by Long-Term Holders
On-chain data from Glassnode show that in late June, long-term holders (LTH) took substantial profits: $849 million from coins held 3–5 years, $485 million from those held 7–10 years, and $445 million from 1–2-year coins. Daily realized profits peaked at $2.46 billion, with a seven-day average of $1.52 billion, surpassing the year-to-date average of $1.14 billion but remaining below the $4–5 billion peaks of Q4 2024.
Despite this sizable sell-off, Bitcoin’s price has held within a $100,000–$110,000 range, signaling that fresh demand continues to absorb the supply.
Figure: Realized Profits by Long-Term Holder Age Band (million USD)
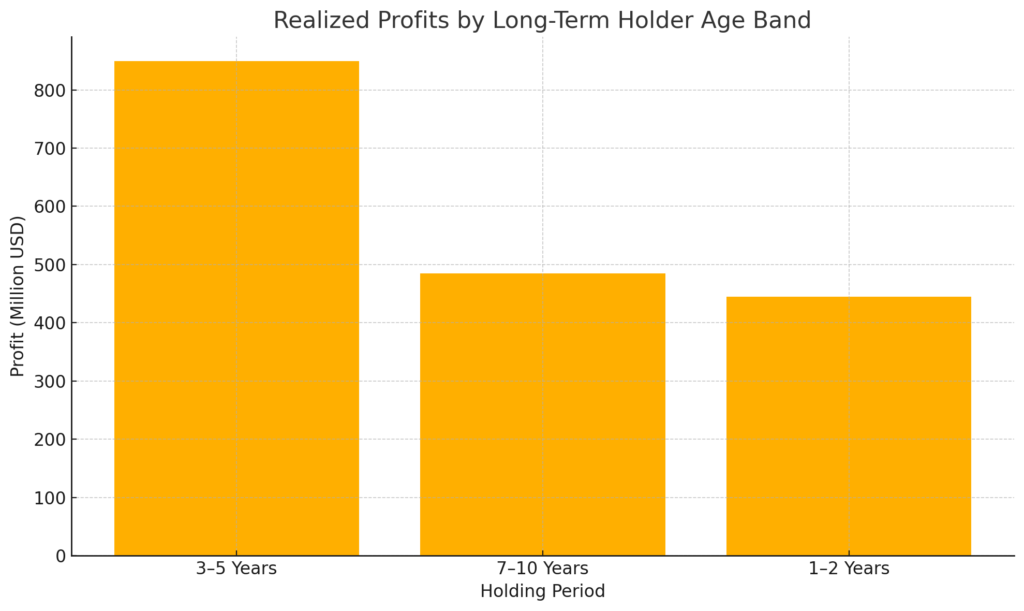
See chart above in “Realized Profits by Long-Term Holder Age Band”
2. On-Chain Metrics Signal Healthy Rotation
CryptoQuant analyst Yonsei Dent highlights two key indicators:
- Spent Output Age Bands (SOAB): Shows when coins of different age bands are moved.
- Binary Coin Days Destroyed (CDD): Flags if LTHs moved coins on a given day (yes/no).
Dent notes that the persistent movement of older coins—often seen as distribution—can be positive in a bull market, reflecting profit-taking by seasoned holders who then make way for new entrants. Activity has also picked up among coins held 1–3 years, implying profit realization by buyers from the last cycle. “This transition of market leadership from older holders to newer ones is a sign of strength, not weakness,” Dent observes.
3. Historical July Seasonality Favors Bitcoin
Looking back to 2013, July has been Bitcoin’s best-performing month, with:
- Average return: 7.56 %
- Highest return: 24.03 % in July 2020
- Lowest return: −9.69 % in July 2014
Bitcoin closed higher in 8 of the last 12 Julys and has delivered an average gain of 7.56 % over the period.
This seasonal trend often aligns with broader risk-asset strength in Q3, suggesting that July 2025 could continue the pattern.
4. Correlation with the S&P 500 and Macro Tailwinds
June 2025 saw the S&P 500 close at record monthly highs. Historically, Bitcoin’s July returns have tracked those of equities, particularly large-caps. Analysts argue that if the S&P 500’s momentum persists, Bitcoin could follow suit and challenge $112,000 or higher within the month.
5. Technical Analysis: The “Cycle 4 Range Expansion”
According to CryptoCon’s technical review, since December 18, 2024, Bitcoin has been in a 195-day sideways phase, yet only 36 days saw meaningful price moves—indicative of a “cycle 4 range expansion.” In prior cycles, similar prolonged bases were followed by 30–40-day breakouts that propelled BTC to new highs before reverting to sideways consolidation.
If this pattern holds, the next major leg could drive prices toward $140,000–$150,000, after which a brief correction might ensue.
Conclusion
Despite significant profit-taking by long-term holders, Bitcoin’s price resilience underscores robust demand from incoming participants. On-chain metrics reveal a constructive redistribution of supply that often precedes bull-market breakouts. Combined with historic July seasonality, positive equity correlations, and a long-standing range expansion, the setup points toward a potential rally above $112,000—and possibly as high as $150,000—before a natural pullback. For investors scouting new crypto assets, this confluence of signals may mark an opportune moment to position for the next leg of Bitcoin’s bull market.