
Main Points:
- Failed Breakout at $109,000: Bitcoin attempted but failed to breach the $109,000 level on June 29–30, signaling a potential local top or range-bound phase.
- Key Support at $104,500: The next major support lies at $104,500, with a breach opening the path toward the $100,000 psychological level.
- ETF Inflows Bolstering Sentiment: Bitcoin spot ETFs saw roughly $111 million in inflows on June 30, contributing to a record half-year total of $14.9 billion across crypto ETPs.
- Neutral Momentum Indicators: The 20-day EMA is trending upward, but RSI hovering near neutral suggests muted momentum in the short term.
- Broader Market Context: U.S. equities rallied early July, with Bitcoin up ~2% alongside major tech gains, reflecting risk‐on sentiment.
- Upside Triggers: A rebound above the 20-day EMA and a break of the descending trendline could target prior all-time highs near $111,980.
- Macro and Regulatory Drivers: Anticipated SEC approvals for new crypto ETFs (e.g., XRP, ADA, SOL) and ongoing regulatory clarity in the U.S. are underpinning long-term bullish case.
Market Overview and Failed Breakout
Bitcoin (BTC) attempted to break above $109,000 on June 29 and 30 but was met with strong selling pressure, ultimately retreating to $105,250 on July 1. This failure to sustain a move above $109,000 suggests the formation of a local top or the beginning of a broader consolidation phase between $100,000 and $110,000. Across daily charts, BTC remains trapped beneath a descending trendline while oscillating around the 20-day exponential moving average (EMA), a setup that typically precedes range expansion in the coming days.
| Date | Price (USD) |
|---|
| 2025-06-29 | $109,000 |
| 2025-06-30 | $109,000 |
| 2025-07-01 | $105,250 |
Key Support and Resistance Levels
- Support at $104,500: The most critical intraday support is at $104,500—a level where bullish forces previously defended aggressively. A daily close below this could trigger further downside momentum toward the $100,000 psychological barrier.
- Major Psychological Level at $100,000: Beneath $104,500, $100,000 acts as a crucial floor; loss of this level would intensify bearish sentiment, potentially accelerating declines.
- Resistance at the 20-Day EMA and Trendline: On the upside, the immediate hurdle is the 20-day EMA (around $106,144), followed by the descending resistance trendline. A sustained break above both could set the stage for a re-test of the all-time high near $111,980.
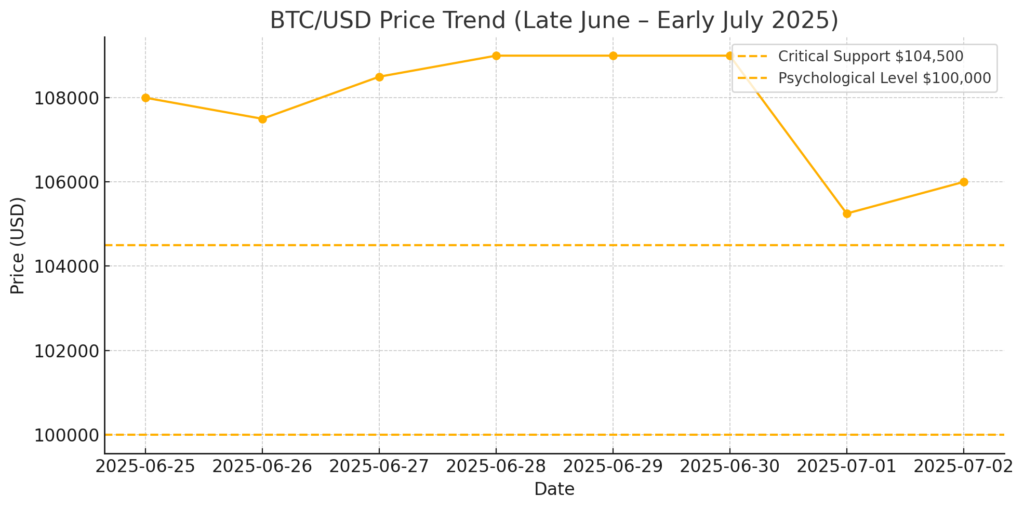
Chart: BTC/USD Price Trend (Late June – Early July 2025)
Below is the BTC/USD price trend from late June through early July, highlighting the $104,500 support and $100,000 psychological level:
Technical Indicators and Momentum
- 20-Day EMA: The 20-day EMA is mildly upward-sloping, giving bulls a slight edge in the short term. However, price action has repeatedly tested and momentarily dipped below this line, indicating cautious buying at best.
- Relative Strength Index (RSI): The RSI hovers around the neutral 50 level on the daily chart, reflecting a lack of decisive momentum. Moves above 60 or below 40 would provide clearer directional signals for traders.
ETF Inflows Provide Underlying Support
June 2025 saw unprecedented inflows into U.S. spot Bitcoin ETFs. On June 30 alone, Bitcoin ETFs attracted $111 million, contributing to $14.9 billion in net inflows year-to-date, which represents about 84 percent of total crypto ETP inflows in H1 2025. Continuous ETF demand has been a primary driver of Bitcoin’s resilience, even as spot price consolidates.
Broader Market Dynamics
Equity markets in the U.S. kicked off July with gains: the Dow rose 0.8%, Nasdaq climbed 1.5%, and S&P 500 advanced 0.9% on July 1, buoyed by easing geopolitical tensions and strong tech earnings. Bitcoin outperformed early in the session, rising roughly 2% alongside a surge in Coinbase shares, which jumped over 7% amid bullish regulatory outlooks.
Regulatory Environment and Future Catalysts
- SEC ETF Approvals: Anticipation of SEC approvals for new spot ETFs, including XRP, ADA, and SOL, has added tailwinds to the crypto space. Analysts predict a wave of approvals in summer 2025, with a cumulative $6 billion inflow already boosting Bitcoin and Ethereum products.
- U.S. Legislative Clarity: Ongoing legislative initiatives like the Genius Act and the Digital Asset Market Clarity Act are set to create a more robust regulatory framework for digital assets, enhancing institutional participation and market depth.
Scenarios and Trading Strategies
- Bearish Scenario: A clean break and daily close below $104,500 could trigger accelerated selling, targeting $100,000 or lower. Traders may use this level for short entries with stops above recent swing highs.
- Bullish Scenario: A decisive rally above the 20-day EMA and descending trendline resistance would open a path toward $111,980 (all-time high) and potentially $120,000 in the medium term. Long positions could be initiated on a confirmed breakout with stops below the EMA.
- Neutral/Range-Bound: Should price oscillate between $104,500 and $109,000, range-trading strategies (buy near support, sell near resistance) may prevail.
Conclusion
Bitcoin’s recent failed breakout at $109,000, coupled with the looming support test at $104,500, places it at a critical juncture. While neutral momentum indicators suggest consolidation, robust ETF inflows—totaling $14.9 billion in H1 2025—and improving regulatory clarity provide a bullish backdrop. Traders should watch for a daily close below $104,500 for a bearish continuation or a reclaiming of the 20-day EMA to signal renewed upside. Meanwhile, pending SEC approvals for additional crypto ETFs and strong institutional demand remain key long-term catalysts.