Main Points:
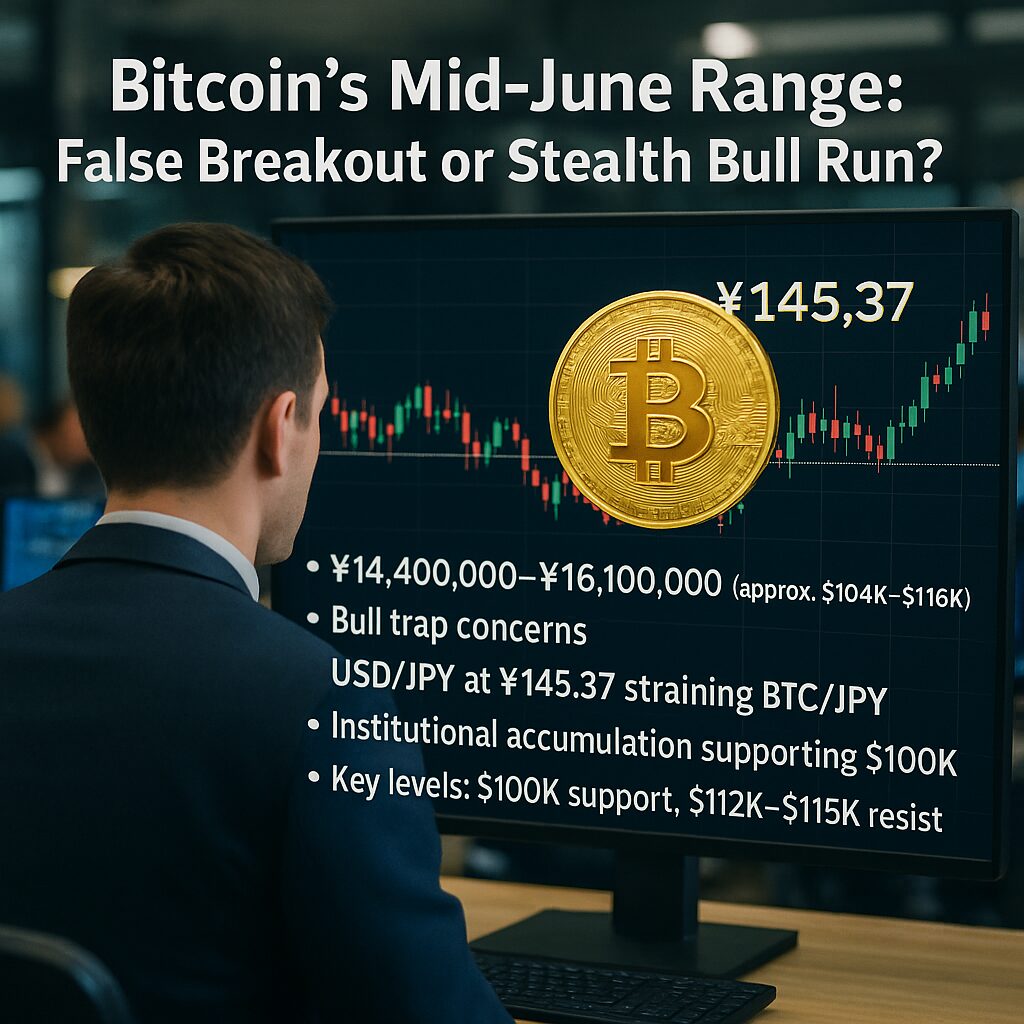
- Bitcoin has traded in a tight range between ¥14,400,000 and ¥16,100,000 (approximately $100,000–$116,000) since mid-May.
- Monday’s sharp climb was quickly reversed, raising concerns of a bull-trap rather than a sustainable breakout.
- Strengthening U.S. dollar, which recently reached ¥145.37 per $1, exerts downward pressure on BTC/JPY despite global bullish sentiment.
- Continued institutional accumulation underpins near-term support around $100,000, even as retail interest softens.
- Key levels to watch: $100,000 as critical support; $112,000–$115,000 as resistance zone whose breach could signal the next major trend.
Price Range and Key Levels
From mid-May through June 17, Bitcoin has oscillated between a well-defined support line near ¥14,400,000 ($100,000) and resistance at roughly ¥16,100,000 ($115,000). During this period, the coin’s Japanese-yen price has never decisively broken out of this roughly ¥1.7 million (~$11,900) band, illustrating the market’s current indecision. The intra-range high of ¥16,129,872 ($110,997) coincides with previous supply clusters, causing swift pullbacks whenever bulls attempted to push beyond that ceiling. Conversely, the May 23 low of ¥14,445,066 ($99,403) tested the buyers’ resolve, with the ¥14.4 million ($100,000) level repeatedly absorbing selling pressure and preventing deeper declines. As of June 17, Bitcoin was trading at ¥15,719,205 ($108,171)—just above the midpoint of this range—leaving investors to anticipate whether price will retest support or finally clear resistance toward new highs.
Data Highlights:
- High (mid-May to June 17): ¥16,129,872 ($110,997)
- Low (mid-May to June 17): ¥14,445,066 ($99,403)
- Closing Price (June 17, 07:29 JST): ¥15,719,205 ($108,171)
False Breakout Warning
On Monday, Bitcoin briefly spiked above the range’s midpoint, fueling optimism that the long-running congestion was ending. Yet, this surge proved illusory: by Tuesday, price had surrendered most gains and slumped back toward the midpoint. Such “false breakouts” often lure breakout chasers into overleveraged positions, only to trigger rapid liquidations and exacerbate volatility. Technical analysis from Investopedia highlights that recent attempts to break above $106,500–$107,000 have been met with diminishing volume, a classic hallmark of a bull-trap scenario rather than a genuine trend change.
Volume-based confirmation is crucial: unless trading volumes swell decisively on a breakout, traders should remain cautious. Historical patterns show that real breakouts tend to coincide with 20–30% spikes in average daily volume. Absent that surge, rallies often fizzle and revert to the mean.
Macro Headwinds: USD Strength
Concurrently, broad U.S. dollar strength represents a headwind for Bitcoin denominated in yen and other currencies. On June 17, the ICE U.S. Dollar Index (DXY) climbed to 98.82—its highest level in months—after a bout of mixed U.S. economic data and rising Treasury yields. In the Tokyo session, the dollar peaked at ¥145.37, up from ¥144.60 the previous day. This yen weakness amplifies Bitcoin’s JPY-translated volatility: even if BTC/USD holds firm, a stronger dollar‐yen rate can mute Bitcoin’s gains in local currency terms.
Additionally, reports of heightened geopolitical tensions in the Middle East have spurred safe-haven flows into the greenback, further pressuring risk assets including cryptocurrencies. If the dollar’s upward trajectory persists—especially above key resistance near 101.79 on the DXY—Bitcoin may struggle to mount a sustained rally above the current range without a notable shift in FX dynamics.
Institutional Interest and On-Chain Indicators
Despite these headwinds, institutional demand remains a supportive factor for Bitcoin’s price floor. Recent data indicates that regulated custodian entities and ETF issuers added net inflows of over $1 billion last week, maintaining Bitcoin’s total ETF assets above $132 billion. This ongoing accumulation suggests that long-term investors view the current price band as a buying opportunity rather than a distribution zone.
On-chain metrics corroborate this outlook: exchange reserves have continued to decline, signaling persistent net withdrawals and a preference for self-custody. Meanwhile, the number of active addresses has stabilized near pandemic highs, implying that network usage remains robust. Such supportive dynamics often precede sustained uptrends once external catalysts align.
What Lies Ahead
With Bitcoin sandwiched between two formidable levels, traders and investors should monitor the following zones closely:
- Support: $100,000 (approx. ¥14.4 million)
- Intermediate Floor: $105,000 (mid-range equilibrium, confluence of 50-day moving average)
- Resistance Cluster: $112,000–$115,000 (April–May swing highs; psychological thresholds)
A decisive close above $112,000 on daily and weekly charts—accompanied by at least 25% higher volume—would invalidate the current rangebound thesis and likely trigger a run toward $137,000, in line with prior golden-cross breakouts. Conversely, a drop below $100,000, particularly underpinned by renewed dollar strength, could signal a return to last year’s $70,000–$80,000 consolidation zone, marked by reduced inflows and rising macro uncertainty.
Strategic Considerations for Practitioners:
- Range Traders: Continue selling near ¥16.1 million ($115,000) and buying at ¥14.4 million ($100,000), maintaining tight stops.
- Breakout Hunters: Wait for volume-confirmed closes beyond key levels ($112k resistance or $100k support) before scaling positions.
- Long-Term Investors: Use dips toward support as accumulation zones, given institutional inflows and favorable long-term on-chain trends.
- Risk Managers: Hedge directional exposure via options or inverse ETFs to guard against sudden dollar strength or macro shocks.
Conclusion
Bitcoin’s price action in mid-June 2025 epitomizes the tug-of-war between bullish institutional interests and bearish macro FX pressures. While the ongoing range between ¥14.4 million ($100,000) and ¥16.1 million ($115,000) underscores market indecision, the potential for a genuine breakout has not vanished. Key variables—volume confirmation, U.S. dollar trajectory, and institutional flow data—will likely dictate whether Bitcoin embarks on a sustained rally or undergoes another corrective slump. For practitioners seeking new revenue streams and hands-on blockchain applications, mastering these dynamics offers both trading opportunities and deeper insights into digital asset market behavior.


