Main Points:
- Bitcoin remains supported at key levels around $103,000–$105,000 but faces resistance near $106,000, with potential to revisit $130,000 if bulls prevail; downside risk limited to $93,000 if $100,000 fails
- Ethereum attempts to hold the 20-day EMA (~$2,500) as a bullish pivot; break above $2,738 could target $3,000, while a drop below $2,323 may see sharper declines
- XRP trades within $2.00–$2.65, needing to close above the 20-day EMA (~$2.27) to aim for $3.69; failure to hold $2.00 risks a fall to $1.61
- Solana is stuck between $153 support and $157–$165 overhead; a break below $153 could target $140, whereas a rebound might retest $165 and even $177
- Institutional flows remain strong, lifting crypto ETFs and driving miner stocks; broader market sentiment is influenced by U.S.–China trade tensions and political backing for crypto as a “safe haven”
- Technical patterns like inverted head-and-shoulders on XRP and bull flags on Bitcoin and Ethereum hint at potential sharp rallies, yet macro headwinds and regulatory uncertainty could cause intermittent pullbacks
- Investors seeking new crypto assets and revenue sources should monitor on‐chain metrics, ETF inflows, and network developments (e.g., Solana’s DeFi usage), while balancing risk at key support levels
Introduction
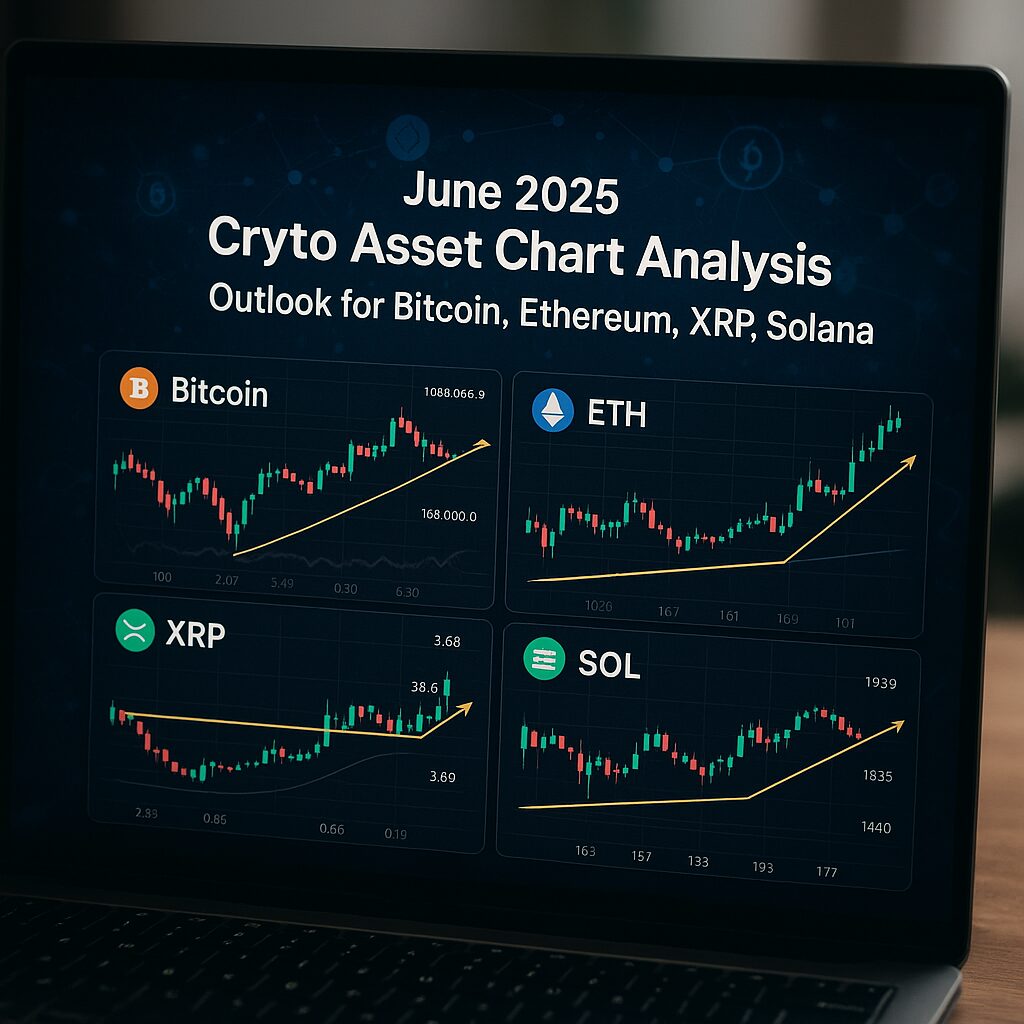
Cryptocurrency markets in early June 2025 find themselves at a pivotal juncture. After a meteoric rise in May, most large‐cap digital assets are consolidating near critical technical levels. This article provides a detailed English overview of the original Japanese chart analysis on Bitcoin (BTC), Ethereum (ETH), XRP, and Solana (SOL), supplemented with the latest market developments and insights from diverse sources. Readers looking for new digital assets, next revenue opportunities, or practical blockchain use cases will gain valuable context on price dynamics, institutional flows, and potential entry points. Following the English analysis, a full Japanese translation is provided to ensure bilingual accessibility.
Bitcoin Price Analysis
Key Levels and Bernanke-style Support
Bitcoin’s daily chart shows a recent rejection from the 20‐day exponential moving average (EMA) around $105,232, indicating that bulls have been fiercely defending this zone. On June 2, BTC/USDT dipped below this EMA but quickly reclaimed it, emphasizing buyer intent at $103,000. Failure to hold $103,000 could push prices down to the psychologically critical $100,000 level, where historically strong demand emerged in late May after a brief pullback from an all-time high above $111,000. If bulls lose $100,000, the subsequent support sits near $93,000, where short-term holders’ break-even costs lie and may trigger a sell-off if breached.
Upside Projection and Institutional Tailwinds
On the upside, if Bitcoin manages a daily close above $106,000, it is poised to challenge a resistance cluster between $109,588 and $111,980. Breaching this zone could ignite a rapid extension toward $130,000, fueled by continued ETF inflows and institutional demand. May 2025 saw record inflows of $3.3 billion into digital asset products, with Bitcoin leading, indicating structurally strong demand despite macroeconomic uncertainties. Moreover, Bitcoin miners have enjoyed outsized gains, reflecting improved miner economics, stalled hashrate growth, and regulatory clarity in major jurisdictions.
Macro Factors and Safe‐Haven Narrative
Persistent U.S.–China trade tensions cast a dual narrative: cryptocurrencies serve as both risk-on assets in bullish races and safe‐havens amid geopolitical strife. On June 2, Bitcoin briefly rose above $111,000, affirming its status as an inflation hedge and portfolio diversifier. However, comments by influential figures (e.g., Elon Musk’s announcements failing to buoy prices) have created short-term volatility, with some analysts predicting a pullback to $97,000 if critical supports falter.
Practical Takeaways for Investors
- Entry Points: A conservative entry could be near $103,000–$105,000, where demand zones overlap with the 20‐day EMA and psychological $100,000 level.
- Risk Management: A stop loss around $93,000 helps contain downside if the $100,000 base fails.
- Long-Term Outlook: Continued institutional adoption (ETF flows, corporate treasuries, mining stocks) supports a bullish bias; if $110,000–$112,000 is reclaimed, a run to $130,000 becomes likely.
- Blockchain Use Cases: Bitcoin’s improving L2 ecosystems (e.g., Lightning Network) and increased on‐chain activity suggest practical applications for value transfer, micropayments, and international remittances.
Ethereum Price Analysis
Holding the 20‐Day EMA as a Pivotal Support
Ethereum’s daily chart reveals sellers pushing ETH toward the 20‐day EMA near $2,502, but buyers have thus far kept this level intact. A decisive close below $2,500 would tilt the short‐term bias toward bears, potentially sending ETH down to strong support near $2,323, representing the intraday low seen in late May.
Upside Potential and Bull Flag Indicators
Conversely, a robust bounce from the current level and a break above $2,738 would indicate resumption of the bullish trend, with the next target near $3,000. Although resistance at $2,850 may temporarily impede upward momentum, technical patterns such as a bull flag on ETH’s daily chart signal upside of $3,069 if the breakout is confirmed. As of June 3, price action shows ETH recovering 2.8% intraday, trading at ~$3,800 on a USD basis (note: USD trading pairs show slightly higher nominal values due to pairing vs USDT).
Influences from Network Upgrades and DeFi Activity
Ethereum’s fundamental narrative is bolstered by ongoing network upgrades like the injection of proto-danksharding in Q2 2025, which is expected to lower L2 gas costs and boost DeFi activity. Total value locked (TVL) across major L2 rollups has surged by 15% since April, reflecting more efficient transaction throughput and lower fees, which underpin practical usage for decentralized applications (dApps) and revenue-generating protocols.
Investment Considerations and Revenue Streams
- DeFi Yield Farming: With TVL rising on Optimism and Arbitrum, opportunities exist for yield farmers to earn double-digit APYs, especially around key support levels ($2,500–$2,600).
- Staking Rewards: Ethereum’s staking APR hovers near 4.5%–5%, presenting a stable income stream for long-term holders who lock ETH in validator nodes.
- NFT & Metaverse Exposure: As major projects migrate onto L2 networks, NFT minting and on-chain gaming interactions stand to benefit from lower fees, indirectly supporting ETH demand.
- Risk Profile: A break below $2,323 could trigger stops, making $2,300–$2,250 an important “pivot zone” for managing short-term risk.
By monitoring on‐chain metrics (e.g., active addresses, ETH burned) and network upgrade timelines, investors can better align positions with long-term growth catalysts.
XRP Price Analysis
Trading Range and EMA Dynamics
XRP has been oscillating between $2.00 and $2.65, reflecting a state of supply-demand equilibrium. On the daily chart, the 20‐day EMA sits near $2.27, where selling pressure is expected to intensify. If XRP fails to hold the 20‐day EMA, bears may push the price below $2.00, opening a drop toward the $1.61 support level, which served as a key floor during April’s consolidation.
Inverted Head-and-Shoulders and Bullish Targets
Conversely, a daily close above the 20‐day EMA could target $2.65, completing an inverted head-and-shoulders pattern. This bullish pattern’s measured move points to $3.69 as the next objective, contingent on breaking $2.65 resistance. As of June 2, XRP’s price at ~$2.15 indicates a minor dip from its January peak of $3.31, but on‐chain data shows increasing token transfers between exchanges and wallets, suggesting renewed demand ahead of possible price triggers.
Regulatory Sentiment and Litigations Impact
XRP’s price trajectory is also sensitive to progress in the ongoing SEC versus Ripple lawsuit. Recent filings in late May 2025 signal potential clarity by mid-summer, a catalyst that can drive price spikes if favorable to Ripple Labs. Meanwhile, broader adoption of RippleNet by major institutions (e.g., Santander’s renewed corridor services) adds fundamental support.
Strategies for Yield and Revenue
- Liquidity Provision: XRP liquidity pools on decentralized exchanges like Sushiswap and Curve offer attractive APRs above 10% amidst low volatility, particularly around the $2.20 range.
- Staking Alternatives: Though XRP does not natively stake, synthetic staking instruments available on DeFi platforms provide a 5%–6% yield, leveraging wrapped XRP tokens.
- Payment Use Cases: Corporate usage of XRP for cross-border settlements via RippleNet continues to grow, making XRP an appealing asset for payment-focused revenue strategies.
- Risk Management: A protective stop around $1.90 guards against deeper downside, while a breakout above $2.50 hints at a path toward $3.00 and beyond.
Investors should watch for trading volume spikes near $2.27 and any regulatory developments to gauge momentum. On-chain whale accumulation at the $2.00–$2.20 range suggests a potential bullish buildup.
Solana Price Analysis
Support at $153 and SMA Resistance
On the daily chart, Solana’s key support sits at $153, where buyers have attempted defense. However, the 50‐day simple moving average (SMA) around $157 has capped rallies, indicating bearish control in the near term. The 20‐day EMA of $165 has turned downward, and the RSI below 50 confirms downward momentum.
Bearish RSI and Oversold Signals
RSI readings near 41.66 on June 1 suggest Solana is approaching oversold territory. Should $153 break, $140 becomes the next support, aligning with late May swing lows and coinciding with the 100‐day moving average zone. Conversely, if SOL rebounds from $153, bulls will likely attempt to clear the 50‐day SMA at $157 to target the 20‐day EMA at $165. Successfully breaching $165 could pave the way for retests of the May 28 high near $177.
Network Developments and DeFi Metrics
Solana’s on-chain activity remains robust, with average daily transactions above 3.5 million and rising Total Value Locked (TVL) in Solana-based DeFi protocols (currently ~$1.8 billion). Key projects like Serum, Raydium, and the emergent Solaxy Layer-2 chain report new all-time highs in TVL, indicating practical growth in decentralized exchange usage and liquid staking solutions.
Investment and Revenue Opportunities
- Yield on DeFi Protocols: Liquidity provision on Raydium pools yields upwards of 8%–10%, especially around programmatic incentives that reward new stakers.
- NFT and Gaming Integration: Solana’s ultra‐low fees attract NFT marketplaces and gaming studios, presenting potential gains through early token allocations (e.g., Magic Eden governance tokens).
- Staking APR: Solana staking rewards hover around 6%–7%, providing a stable return for delegators who lock SOL in validator nodes, though accompanied by slashing risk and network congestion.
- Risk Controls: A stop loss near $148 can mitigate drawdown if $153 support fails, while a confirmed break above $165 opens a path to $177–$185 in the medium term.
Investors exploring blockchain applications will find Solana’s high throughput and low fees ideal for DeFi and Web3 use cases, but must monitor network outages or congestion events, as previous disruptions (e.g., the April 2025 rollout of on‐chain governance) showcased the fragility of cluster networks under stress.
Market Context and Broader Trends
Institutional Flows and ETF Dynamics
May 2025 saw record inflows into crypto investment products, with $3.3 billion entering the market just last week, bringing year‐to‐date inflows to $10.8 billion. Bitcoin dominated these flows, though XRP experienced outflows after 80 consecutive weeks of net inflows. Such institutional engagement underscores a structural narrative: digital assets are increasingly viewed as legitimate portfolio allocations alongside equities and bonds.
Geopolitical Headwinds and Sentiment
Renewed U.S.–China trade tensions on June 2–3 added volatility, with Bitcoin dipping 0.3% after early gains, while gold futures also rose, reflecting a classic “flight‐to‐safety” dynamic. Simultaneously, political backing from the U.S. administration (e.g., VP JD Vance’s keynote in Las Vegas) has catalyzed optimism around regulatory frameworks and possible federal crypto safeguards, fueling bull narratives across major tokens.
Technical Pattern Confluence
- Bitcoin: Bull flag patterns and rising institutional demand suggest a potential rally toward $145,000 by year‐end if current supports hold; miners’ stocks rally corroborates on‐chain bullishness .
- Ethereum: On‐chain metrics (e.g., ETH burned per day) and a bull flag formation imply a run toward $3,069, provided $2,500 remains intact.
- XRP: Inverted head‐and‐shoulders pattern projects a target near $3.69, contingent on a break above $2.65, though legal news remains a wildcard.
- Solana: Oversold RSI and rising DeFi TVL point to a potential bounce to $165–$177, but a break of $153 may initiate deeper drops to $140.
Practical Blockchain Use Cases
For readers focused on practical blockchain applications, these on‐chain trends mirror real-world usage:
- Remittances and Microtransactions: Bitcoin’s Layer‐2 Lightning Network continues to gain adoption for micropayments in cross-border remittances, reducing fees below $0.01 per transaction.
- Decentralized Finance (DeFi): Ethereum’s L2 ecosystems and Solana’s fast‐settling networks power next‐gen decentralized exchanges (DEXs) and lending protocols, creating creative revenue opportunities for yield farmers and liquidity providers.
- Enterprise Integration: RippleNet’s expansion, including new corridors in Asia and Europe, showcases XRP’s role in institutional payment rails, while permissioned blockchain collaborations on Ethereum (e.g., ConsenSys Baseline Protocol) drive cost savings in trade finance.
- NFT & Web3: Solana’s NFT marketplaces and Ethereum’s ERC‐721 standards facilitate digital art and gaming, offering new monetization models for creators and developers.
Conclusion: Balanced Optimism with Strategic Vigilance
June 2025 marks a critical consolidation phase for crypto markets. Bitcoin hovers near $105,000–$106,000, Ethereum battles to hold $2,500, XRP oscillates between $2.00–$2.65, and Solana trades within $153–$165. While technical patterns across major tokens point to potential rallies—$130,000 for Bitcoin, $3,000 for Ethereum, $3.69 for XRP, and $177–$200 for Solana—macro headwinds (trade tensions, regulatory proceedings, network upgrades) can trigger swift corrections.
Key Takeaways for Investors and Practitioners:
- Monitor Technical Pivot Zones: Entry near $103,000 (BTC), $2,500 (ETH), $2.27 (XRP), and $153 (SOL) offers favorable risk-reward; breaches of these levels should prompt reassessment.
- Leverage On-Chain Metrics: Watch ETF flows, miner sentiment, TVL growth, staking rates, and DeFi usage to gauge underlying strength beyond price charts.
- Diversify Across Use Cases: Consider revenue streams from staking (ETH, SOL), liquidity provision (XRP, SOL), yield farming (ETH, SOL), and payment rails (XRP) to capture practical blockchain utility.
- Stay Attuned to Regulatory Catalysts: XRP’s legal developments, potential U.S. ETF approvals, and global policy signals can create abrupt market shifts—prepare to adapt quickly.
- Balance Short-Term Trading & Long-Term Adoption: Tactical trades around support/resistance serve near-term gains, while HODLing for network upgrades and enterprise adoption supports portfolio diversification.
In essence, the current environment blends bullish structural trends—record ETF inflows, growing institutional adoption, and network improvements—with cautionary signals from geopolitical tensions and technical pivot points. Investors seeking next‐generation crypto assets or blockchain revenue opportunities should maintain disciplined risk management, align positions with on‐chain catalysts, and capitalize on practical use cases that drive real‐world utility.


