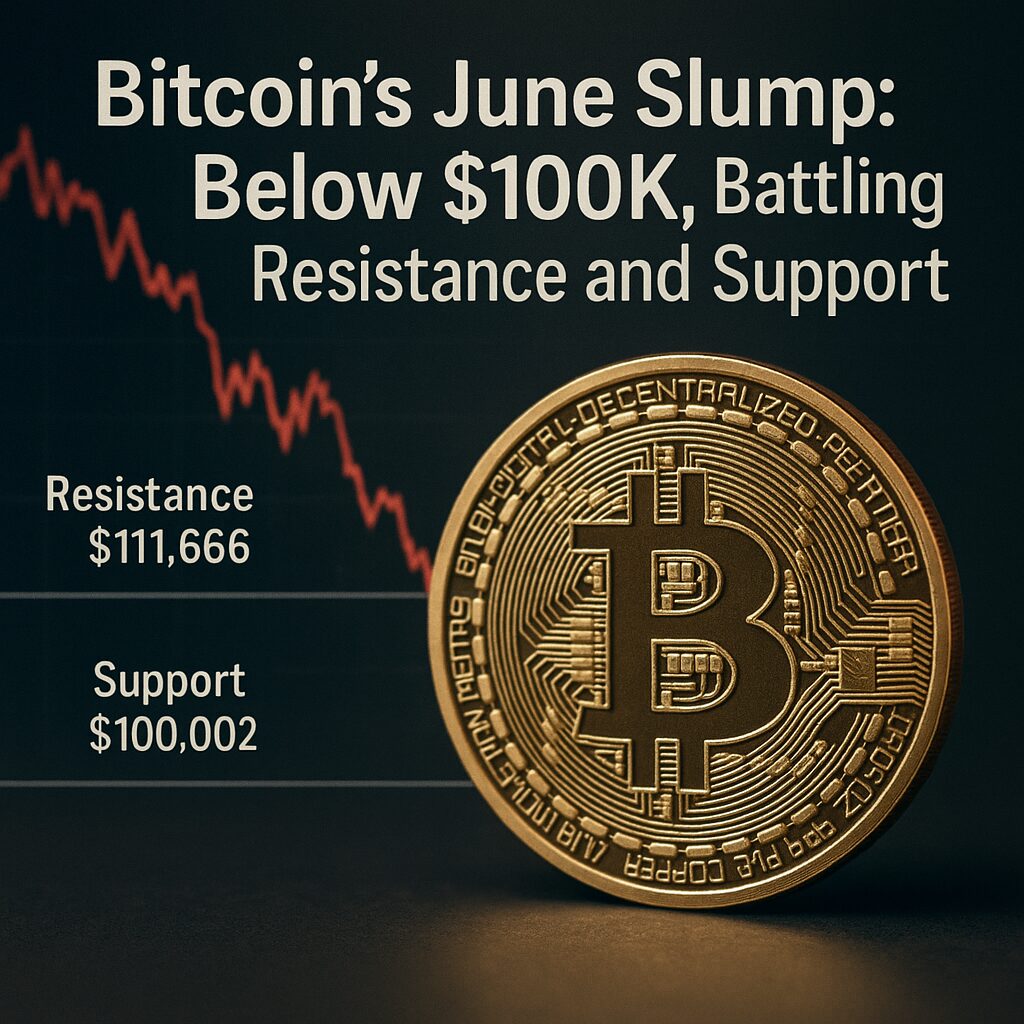
Bitcoin’s June Slump: Below $100K, Battling Resistance and Support
Main Points:
- Bitcoin has formed a tight range between approximately ¥14.4 million ($100 k) and ¥16.1 million ($111.7 k) since late May.
- On June 22, BTC/USD dipped to around $99,237 before a mild rebound, signaling increased downside risk into July and August.
- Key technical levels: Resistance at $111,666; Support at $100,002.
- Ethereum outperformed briefly but also flashed weakness in a June 22 flash crash, dropping to $2,224 before recovering.
- Macroeconomic headwinds (strong dollar, Fed policy, geopolitical tensions) weigh on crypto sentiment.
- Corporate treasury strategies and stablecoin regulatory momentum represent growing on-ramps for institutional demand.
- Traders should watch for a bounce early in the week, but the dominant trend points to potential further declines without a clear break above resistance.
Background and Range-bound Movement
Since May 25, 2025, Bitcoin has oscillated within a well-defined trading band. The upper boundary—around ¥16,100,000 ($111,666)—acted as a strong resistance, while the lower boundary—around ¥14,400,000 ($100,002)—served as dependable support. This range-bound behavior reflects a market in search of direction after BTC’s all-time high of $111,970 on May 22, 2025. Traders have repeatedly tested both limits, but neither side has gained a decisive edge, resulting in consolidation.
Key Price Movements
- High of the Period: ¥16,129,872 on June 1, 2025 (≈ $111,666).
- Low of the Period: ¥14,445,066 on June 5, 2025 (≈ $100,002).
- Latest Price (June 22, 07:25 JST): ¥14,701,876 (≈ $101,780).
On June 22, BTC/USD briefly fell to $99,237—a 4.13% drop from the prior close—before stabilizing, driven by broader risk-off flows in digital assets.
Technical Analysis: Resistance and Support
The range’s boundaries translate into critical technical levels in USD terms:
- Resistance: $111,665.80 (¥16,129,872 / 144.4477).
- Support: $100,002.02 (¥14,445,066 / 144.4477).
A sustained break above resistance would invalidate the bearish bias, potentially reopening the path toward new highs. Conversely, a breach below support risks accelerating the downtrend, possibly targeting $95,000 or lower as next technical floors.
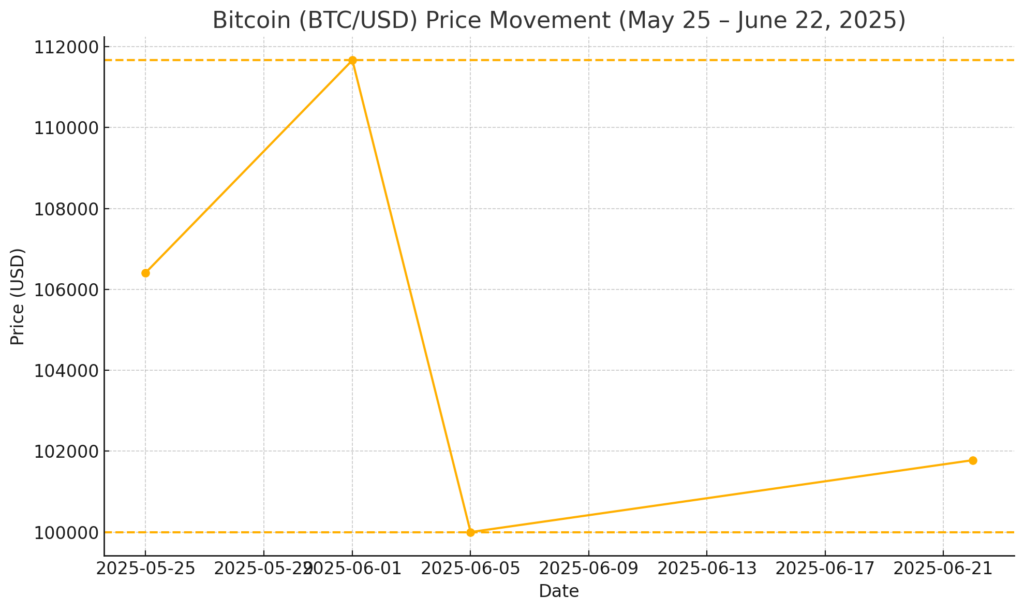
Price Behavior Chart
Below is a clear visualization of Bitcoin’s USD price trajectory from May 25 through June 22, highlighting the resistance and support lines.
Market Sentiment and External Factors
Three macro factors have pressured crypto markets in June:
- Strong U.S. Dollar: The dollar index has strengthened amid Fed hawkishness and geopolitical tensions, reducing dollar-denominated crypto appeal.
- Fed Policy Outlook: After holding rates steady, Fed comments on future rate cuts remain cautious, keeping real yields elevated and risk assets under pressure.
- Geopolitical Uncertainty: Escalating Middle East tensions boost safe-haven flows into the dollar and gold, sidelining risk-off assets like BTC and ETH.
These headwinds have undermined bullish momentum, contributing to Bitcoin’s failure to clear established resistance in early June.
Ethereum’s Flash Crash and Broader Altcoin Weakness
Ethereum mirrored Bitcoin’s weakness but suffered a sharper flash crash on June 22, plunging 7.56% to $2,224 before recovering to $2,292, on five-times-normal volume. Technical charts show ETH struggling to maintain its $2,500 pivot, with key support at $2,218 failing temporarily before buyers stepped in. The broader altcoin market has echoed this volatility, with many tokens retesting key support zones.
Institutional Trends: Treasury Strategies and Stablecoin Regulation
Despite near-term selling pressure, two institutional catalysts offer medium-term support:
- Bitcoin Treasury Strategies: At least 61 publicly-listed companies (outside pure crypto firms) have begun allocating reserves to BTC, seeing it as a hedge and store of value.
- Stablecoin Regulatory Framework: U.S. Congress is poised to pass legislation defining stablecoin oversight, likely legitimizing tokens like USDC and Tether, and embedding them further into mainstream finance.
These developments suggest a maturing market structure that could underpin demand, especially if macro conditions stabilize.
Forecasts and Outlook into Q3 2025
Technical models point to a high probability of further downside pressure through July–August if BTC fails to reclaim $110,000 soon. However, seasonal factors historically favor a year-end rally, leaving room for tactical long entries around support levels. Traders should monitor:
- Weekly Rebound Potential: Early-week relief rallies could materialize as markets digest weekend news.
- Breakout/Bounce Confirmation: A daily close above $105,000 would signal buyer conviction; conversely, a close below $99,000 could trigger stop-loss cascades.
- Macro Event Calendar: Fed minutes, U.S. inflation data, and any escalation in geopolitical conflicts will remain key catalysts.
Practical Implications for Investors
- Range Trading: In the absence of clear trend, opportunistic longs at $100,000 and shorts near $111,700 may offer favorable risk/reward.
- Risk Management: Tight stops around key levels and position sizing are critical in a high-volatility environment.
- Strategic Allocations: Long-term holders should view dips as accumulation opportunities, especially given growing institutional adoption and policy frameworks.
Conclusion
Bitcoin’s failure to sustain a breakout in early June has left it trapped within a $100–$112 k band, with renewed volatility testing investor resolve. While macro headwinds and technical barriers weigh heavily, institutional treasury programs and impending stablecoin regulations offer a structural floor beneath prices. Traders can look for relief rebounds early in the week, but must respect the key resistance at $111,666 and support at $100,002. For those seeking new crypto opportunities, the current market presents tactical entry points—provided risk is managed carefully amid uncertain global markets.
