Key Takeaways :
- The decision to pause interest rate cuts has reintroduced uncertainty, but also renewed upside potential for major crypto assets.
- Bitcoin, Ethereum, XRP, and Solana are all approaching critical technical levels where the next medium-term trend may be decided.
- Beyond price speculation, these assets continue to expand their real-world utility, shaping future revenue opportunities and blockchain-based business models.
- For investors and operators alike, understanding both chart structures and macro context is essential for identifying sustainable opportunities.
1. Macro Background: Why the Rate-Cut Pause Matters for Crypto
The global cryptocurrency market remains highly sensitive to macroeconomic signals, particularly monetary policy decisions in the United States. The recent decision by central banks to pause interest rate cuts has created a mixed environment for risk assets. On one hand, the absence of immediate monetary easing limits short-term liquidity inflows. On the other, it removes the fear of abrupt tightening, offering markets time to stabilize and reassess value.
For cryptocurrencies, this pause acts as a psychological pivot. Bitcoin and other major assets have already undergone significant corrections, and many market participants now view current levels as a battleground between long-term conviction and short-term caution. Historically, periods of monetary policy neutrality have often preceded renewed capital rotation into alternative assets, especially when inflation remains structurally elevated.
2. Bitcoin Price Outlook: The Battle at the Moving Averages
Bitcoin’s recent rebound has brought price action back toward its moving average zone, an area traditionally associated with strong seller resistance. This level represents a technical and psychological threshold where short-term traders tend to lock in profits, while longer-term investors evaluate whether the broader uptrend remains intact.
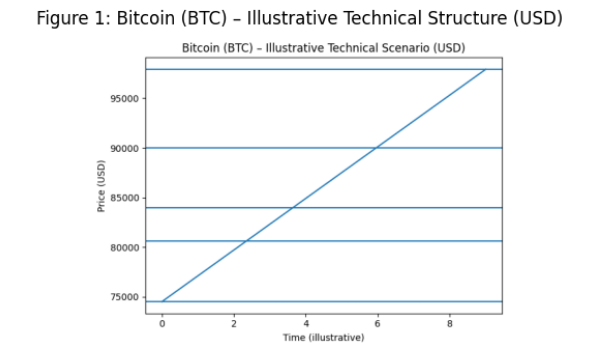
If Bitcoin fails to hold above this zone and turns lower, downside pressure could push prices toward the $84,000 support level. This area is expected to attract strong buying interest. A decisive daily close below it would open the door to a deeper correction toward $80,600, and potentially as low as $74,508, which stands as a historically strong support region.
Conversely, a sustained close above the moving averages would signal renewed bullish momentum. In that scenario, Bitcoin could advance toward the resistance zone between $94,789 and $97,924. A confirmed breakout above this range would strongly suggest that the corrective phase has ended and that the market is preparing for a new expansion cycle.
[Bitcoin (BTC) illustrative technical chart here]
3. Ethereum Price Outlook: Compression Before Expansion?
Ethereum has recently slipped back into a symmetrical triangle pattern, a structure that often precedes large directional moves. While buyers have defended key levels, upward progress has been capped near the moving averages, indicating hesitation and balance between supply and demand.
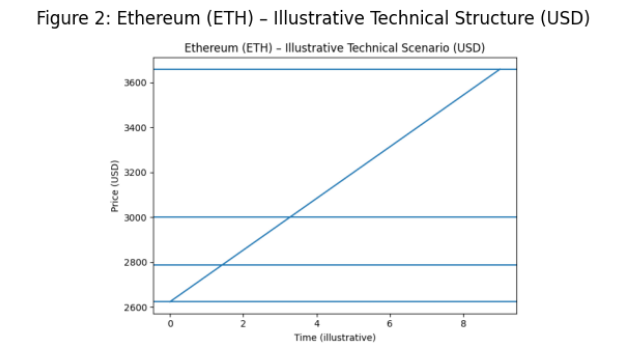
Should Ethereum reverse sharply from the moving averages, sellers are likely to target the $2,787 level. A breakdown below this support would expose the market to a further decline toward $2,623. Such a move would likely coincide with broader risk-off sentiment across digital assets.
However, a daily close above the moving averages would invalidate the recent breakdown attempt. In that case, Ethereum’s probability of breaking above the triangle’s resistance line increases significantly, with $3,659 emerging as the next major upside target. This scenario would reinforce Ethereum’s role not just as a speculative asset, but as the backbone of decentralized finance, staking, and tokenized real-world assets.
[Ethereum (ETH) illustrative technical chart here]
4. XRP Price Outlook: Utility Versus Market Structure
XRP continues to trade at the intersection of technical pressure and long-term utility narratives. Buyers are attempting to push prices above the moving averages, but sellers remain active, reflecting lingering uncertainty.
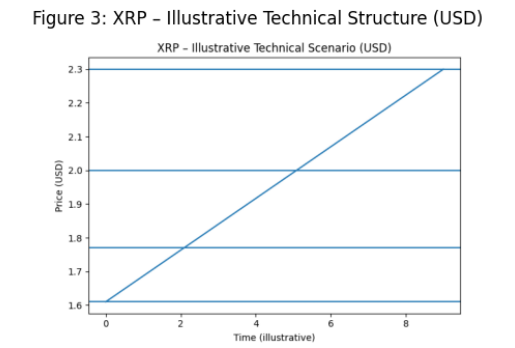
If sellers succeed in driving XRP below $1.77, the market could quickly test the critical $1.61 support zone. This level aligns closely with the lower boundary of the descending channel, making it a focal point for defensive buying.
On the upside, a sustained move above the moving averages would shift momentum toward the descending trendline. A daily close above that trendline would be a meaningful signal that a new bullish phase is underway. Beyond price action, XRP’s ongoing integration into cross-border payment infrastructure continues to attract attention from institutions exploring blockchain-based settlement solutions.
[XRP illustrative technical chart here]
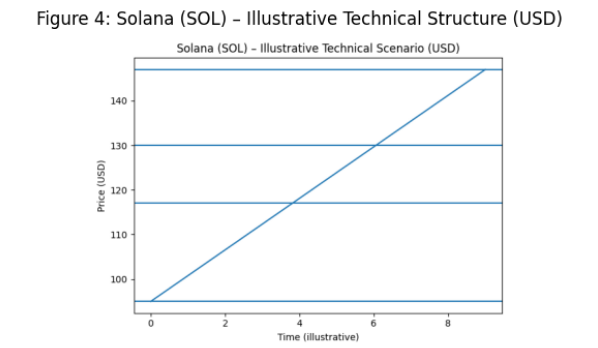
5. Solana Price Outlook: High Performance, High Expectations
Solana has rebounded from the $117 support level, but the recovery faces immediate resistance near the moving averages. This reflects broader market caution, particularly toward high-beta assets.
If Solana fails to break higher and turns down again, sellers may attempt to force a breakdown below $117. A confirmed move below that level would expose the market to a decline toward the strong $95 support zone.
Alternatively, a decisive breakout above the moving averages would clear the path toward $147 resistance. A sustained close above $147 would strongly suggest that the corrective phase has ended. From a fundamental perspective, Solana’s high-throughput architecture and growing ecosystem of consumer-facing applications position it as a leading candidate for real-world blockchain adoption.
[Solana (SOL) illustrative technical chart here]
6. Practical Implications: Beyond Trading
For readers seeking new revenue streams or practical blockchain use cases, these technical setups should not be viewed in isolation. Bitcoin increasingly functions as a macro hedge and balance-sheet asset. Ethereum underpins decentralized finance, staking yields, and tokenization. XRP focuses on institutional payment rails, while Solana targets high-performance consumer and financial applications.
Periods of technical consolidation often coincide with infrastructure development, partnerships, and regulatory clarification. Investors and builders who align technical timing with real-world adoption trends are more likely to identify durable opportunities.
7. Conclusion: A Market at a Decision Point
The pause in interest rate cuts has placed the crypto market at a critical decision point. Bitcoin, Ethereum, XRP, and Solana are all testing levels that could define their next medium- to long-term trajectories. While short-term volatility remains likely, the broader trend suggests that blockchain assets with clear utility and strong ecosystems continue to mature.
For those searching for new digital assets, income opportunities, or practical blockchain applications, this period demands careful observation rather than haste. The next sustained move is likely to reward those who understand both charts and fundamentals.
