Main Points :
- Bitcoin (BTC) is forming higher lows but remains capped below the key resistance near $74,508, with downside risk toward $60,000 and potentially the $50,000 range if macro pressure intensifies.
- Ethereum (ETH) is holding support near $1,897, but must break above $2,183 to confirm recovery toward $2,707.
- XRP is trading just below its 20-day EMA near $1.52, with breakout potential toward $1.80 if momentum builds.
- Solana (SOL) faces heavy resistance near $95, with downside risk to $67 if sellers regain control.
- Macro conditions, ETF flows, and liquidity cycles remain decisive for short-term volatility and long-term positioning.
- For strategic investors, volatility may present asymmetric entry opportunities in Layer-1 ecosystems and infrastructure tokens.
I. Bitcoin (BTC): Between Recovery and Breakdown
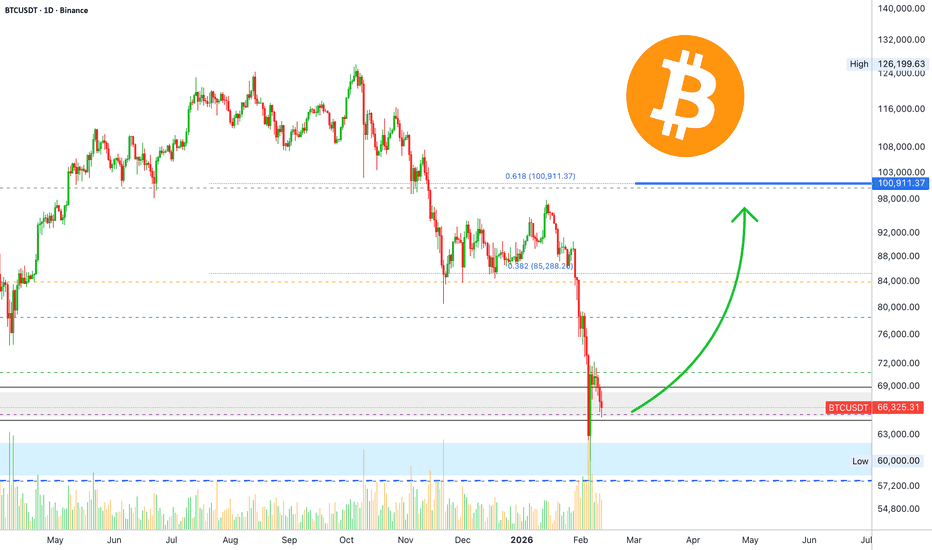
Bitcoin is currently navigating a fragile equilibrium. While the asset has formed a pattern of higher lows in the short term, bulls have repeatedly failed to push the price above the critical resistance level around $74,508—the zone marking the beginning of the latest correction.
The immediate technical battleground lies between:
- 20-day EMA (~$72,282)
- Horizontal resistance at ~$74,508
A decisive breakout above this band could trigger renewed momentum toward the 50-day SMA near $83,129, which would restore medium-term bullish structure.
However, the bearish scenario remains equally plausible. Sellers are likely defending the 20-day EMA aggressively. A breakdown below $65,118 would likely accelerate selling pressure toward $60,000, a psychologically and technically critical support.
If $60,000 fails, the market could retest the broader accumulation zone in the $50,000–$55,000 range.
Macro Overlay
Recent macro dynamics—including tightening liquidity conditions, cautious equity markets, and fluctuating ETF inflows—are influencing crypto volatility. Institutional accumulation via spot ETFs has not fully translated into retail momentum, creating a structurally fragile rally environment.
For long-term allocators, such retracements often provide strategic entry points—particularly when Bitcoin’s realized volatility compresses while hash rate and network fundamentals remain stable.
II. Ethereum (ETH): Structural Support Under Pressure
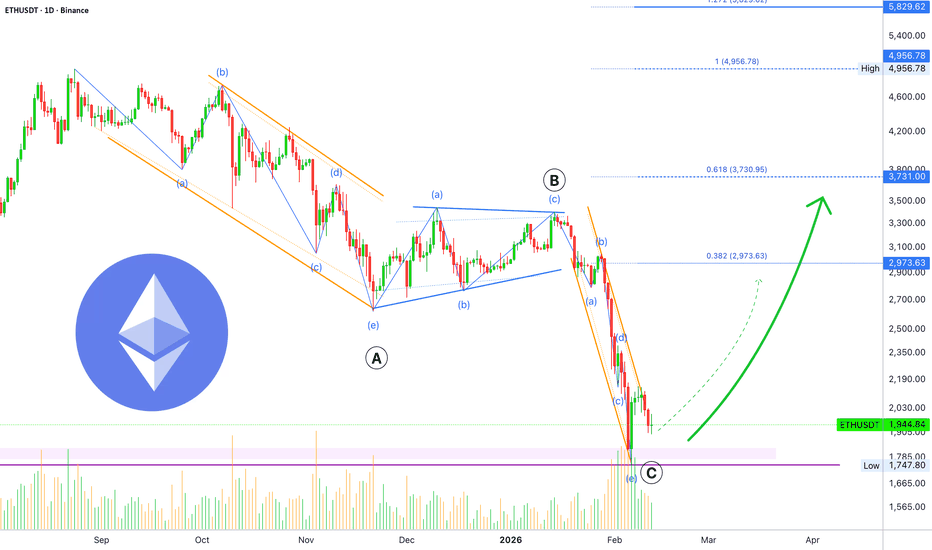
Ethereum remains supported above $1,897, indicating that buyers are accumulating dips. However, recovery momentum remains incomplete.
The critical resistance stands at:
- 20-day EMA (~$2,183)
A successful breakout would open the door to the 50-day SMA near $2,707, signaling a stronger recovery phase.
Conversely, failure to hold $1,897 would suggest that sellers are regaining dominance. The next major support lies at $1,750. A daily close below that level could expose ETH to deeper downside toward $1,537.
Strategic Interpretation
Ethereum’s positioning is more nuanced than Bitcoin’s. Beyond price action, several structural drivers matter:
- Layer-2 adoption growth
- Staking yield dynamics
- Institutional interest in tokenized assets
- Stablecoin settlement activity on Ethereum rails
ETH’s valuation increasingly reflects its role as financial infrastructure rather than a purely speculative token.
III. XRP: Channel Consolidation and Breakout Potential
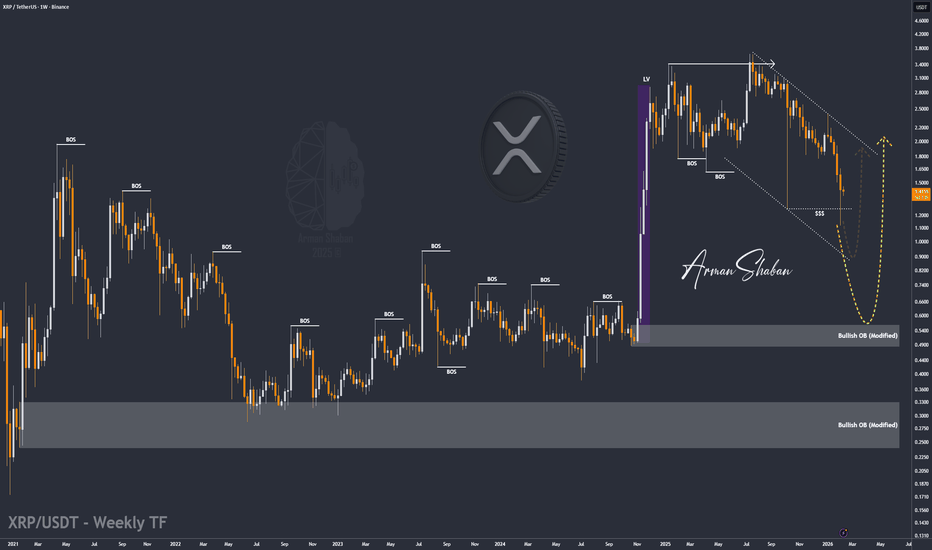
XRP is trading just below its 20-day EMA (~$1.52), suggesting persistent bullish pressure.
Key upside trigger levels:
- Break above $1.52 (20-day EMA)
- Confirmed move above $1.61
If achieved, XRP could climb toward the 50-day SMA near $1.80, maintaining its broader channel structure.
To confirm a genuine trend reversal, buyers must push price above the descending trendline. Without that, XRP risks renewed downside if it loses channel support.
Broader Context
XRP remains highly sensitive to regulatory clarity and cross-border payment narratives. Its asymmetric upside often depends on macro legal developments and adoption by financial institutions rather than pure technical momentum.
IV. Solana (SOL): High Beta, High Risk, High Reward
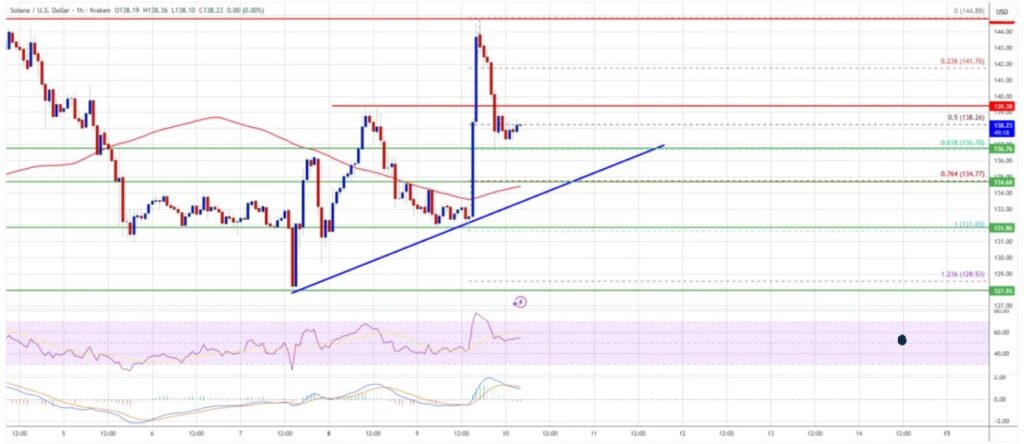
Solana faces immediate resistance near $95, where sellers have become active.
If price falls below $76, it would confirm resistance-to-support reversal (a classic “support becomes resistance” shift). That would likely lead to a retest of $67.
On the upside, a breakout above $95 could drive momentum toward the 50-day SMA at $116, though heavy selling pressure may emerge there.
Ecosystem Perspective
Solana remains one of the highest beta Layer-1 ecosystems:
- Strong developer growth
- Expanding DeFi ecosystem
- High throughput performance
- Increasing stablecoin liquidity
Its volatility is amplified—but so is its upside potential during liquidity expansions.
V. Comparative Risk Map
[Insert Comparative Risk Matrix Chart Here]
| Asset | Bullish Trigger | Bearish Trigger | Critical Support | Upside Target |
|---|---|---|---|---|
| BTC | Break above $74,508 | Below $65,118 | $60,000 | $83,129 |
| ETH | Break above $2,183 | Below $1,897 | $1,750 | $2,707 |
| XRP | Break above $1.61 | Below channel support | ~$1.30 zone | $1.80 |
| SOL | Break above $95 | Below $76 | $67 | $116 |
VI. Strategic Conclusion: Volatility as Opportunity
The possibility of Bitcoin revisiting the $50,000 range cannot be dismissed. Yet such retracements historically precede strong expansion phases—especially when structural adoption trends remain intact.
For readers seeking:
- New crypto assets
- Yield opportunities
- Practical blockchain applications
The key is not predicting the next $5,000 move—but identifying structural positioning advantages:
- Layer-1 scalability plays
- Infrastructure tokens
- Payment settlement assets
- Staking yield strategies
In transitional markets, disciplined allocation during volatility often defines long-term outperformance.
Short-term charts warn of fragility.
Long-term fundamentals suggest resilience.
The market is not collapsing—it is repricing risk.
For strategic participants, that distinction changes everything.
