
Main Points :
- Bitcoin is at a critical equilibrium near its 20-day EMA, with a decisive breakout likely to determine whether the broader correction is ending or deepening.
- Ethereum is compressing within a symmetrical triangle, suggesting a volatility expansion that could redefine its medium-term trend.
- XRP remains structurally weak but is approaching a pivotal technical inflection point that could trigger either a trend reversal or a deeper capitulation.
- Solana continues to show relative strength compared with other large-cap altcoins, yet downside risks remain if moving-average support fails.
- For investors and builders seeking new crypto assets or revenue opportunities, understanding these support and resistance dynamics is essential for both capital allocation and product timing.
Introduction: Why Support Levels Matter in a Correction Phase
In cryptocurrency markets, price corrections are not merely periods of decline; they are phases where long-term structure is either reinforced or decisively broken. For investors looking for new digital assets, yield opportunities, or practical blockchain use cases, understanding where price may stabilize is just as important as predicting upside targets.
Support levels represent zones where demand historically overcomes supply. In highly liquid crypto markets, these levels often align with moving averages, trendlines, and psychologically important round numbers. During a correction, the market repeatedly tests these zones, revealing whether buyers are confident enough to absorb selling pressure.
This article expands upon recent chart analyses of Bitcoin (BTC), Ethereum (ETH), XRP, and Solana (SOL), integrating broader market context and recent trends from multiple sources. Rather than offering short bullet-point predictions, we examine how each asset behaves around key technical levels and what that implies for investors, traders, and blockchain practitioners.
Bitcoin Price Outlook: A Battle at the 20-Day EMA
[Bitcoin Daily Chart]
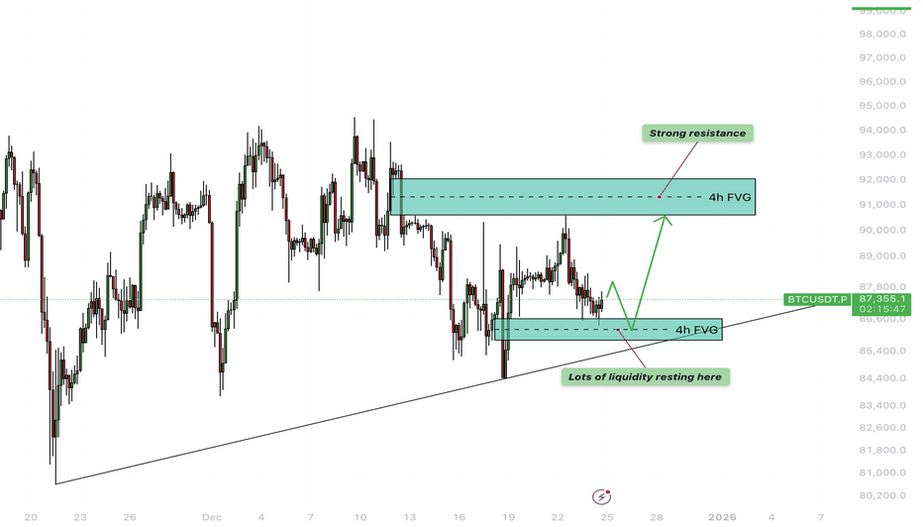
Bitcoin is currently locked in a tight range around its 20-day exponential moving average (EMA), located near $88,439. This zone has become a battlefield between bulls attempting to resume the broader uptrend and bears seeking confirmation that the correction is not yet over.
If Bitcoin manages to break decisively above the 20-day EMA and maintain that level, the next major hurdle lies at the 50-day simple moving average (SMA) around $89,880. A successful breakout above the 50-day SMA would likely attract momentum traders and systematic funds, opening a path toward the resistance level near $94,589.
This $94,589 area is particularly important. A clear daily close above it would suggest that the corrective phase has likely concluded. In that scenario, Bitcoin could re-target the psychologically significant $100,000 level, with extended upside potential toward $107,500, depending on broader liquidity conditions and macro sentiment.
Conversely, failure to hold near the moving averages would reinforce bearish control. A sharp rejection from the 20-day EMA increases the probability of a breakdown below $84,000, exposing downside targets around $80,600, and potentially as low as $74,508. Such a move would likely coincide with reduced risk appetite across altcoins and a temporary slowdown in on-chain activity.
From a strategic perspective, Bitcoin’s current position matters not only for traders but also for builders and institutions. Many blockchain-based businesses time product launches, token distributions, or treasury allocations based on Bitcoin’s trend stability. A confirmed rebound would signal a more favorable environment for risk-on innovation.
Ethereum Price Outlook: Compression Within a Symmetrical Triangle
[Ethereum Daily Chart]
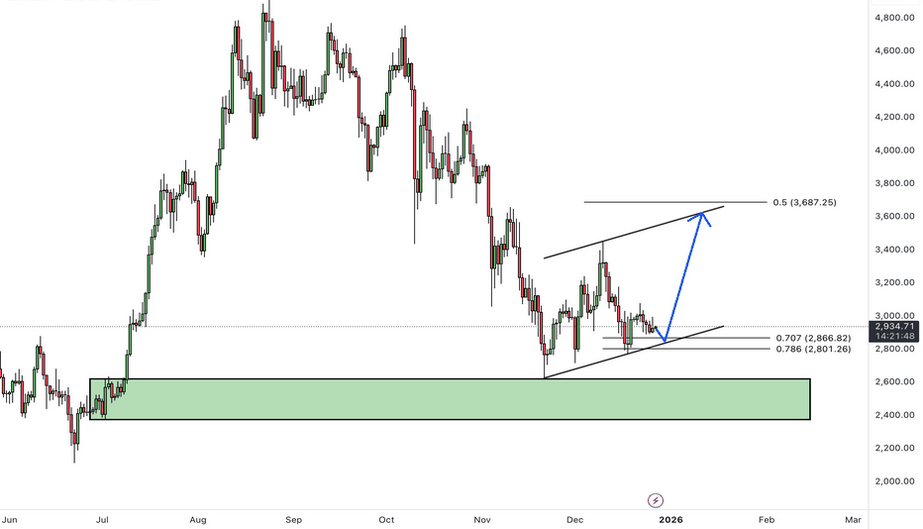
Ethereum’s price action reflects a market in compression. Bulls are attempting to push ETH above the 50-day SMA near $3,019, which would mark an important shift in short-term momentum.
A daily close above this moving average would likely propel ETH toward the resistance line of its symmetrical triangle pattern. Symmetrical triangles typically precede sharp volatility expansions, and a breakout above the resistance line would strongly suggest that the broader downtrend has ended.
In such a bullish scenario, Ethereum could advance toward $4,000, a level that carries both technical and psychological significance. Beyond pure price appreciation, a recovery in ETH often correlates with increased activity across decentralized finance (DeFi), NFTs, and Layer-2 ecosystems, directly impacting real blockchain usage and fee generation.
However, the bearish alternative remains relevant. If Ethereum closes below the triangle’s support line, it would indicate that sellers have overwhelmed buyers. This breakdown could trigger a rapid decline toward $2,623, followed by a deeper retracement to approximately $2,373.
For investors seeking yield or protocol-level opportunities, Ethereum’s direction is critical. Many revenue-generating strategies—staking, restaking, and DeFi liquidity provision—are sensitive not only to ETH’s price but also to network confidence. Sustained weakness could delay capital deployment into these sectors.
XRP Price Outlook: A High-Risk, High-Inflection Setup
[XRP Daily Chart]
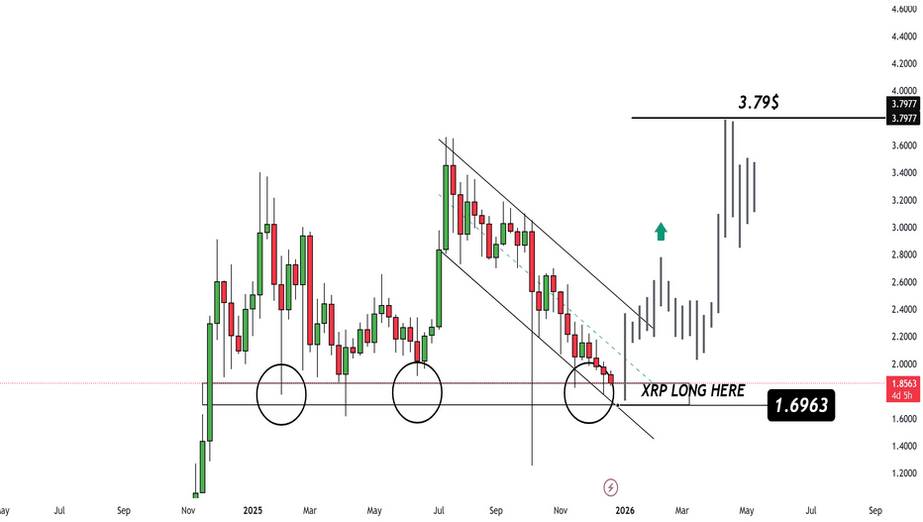
XRP is attempting to form a relief rally by reclaiming its 20-day EMA around $1.91. If bulls succeed, the next upside target would be the 50-day SMA near $2.04, followed by a test of the descending trendline that has capped price advances for months.
This descending trendline is a critical decision point. A breakout and daily close above it would significantly improve XRP’s technical structure, opening the door to a potential rally toward $2.70. Such a move would likely attract speculative interest, particularly from traders focused on mean-reversion opportunities.
On the downside, $1.61 stands out as the most important support level. A daily close below this threshold would signal the continuation of the downtrend, increasing the likelihood of a sharp decline toward the October 10 low near $1.25.
For market participants, XRP represents a classic asymmetric setup. The upside potential is meaningful if a trend reversal occurs, but the downside risk remains substantial. This makes XRP more suitable for tactical positioning rather than long-term allocation unless broader structural confirmation emerges.
Solana Price Outlook: Relative Strength with Defined Risk
[Solana Daily Chart]
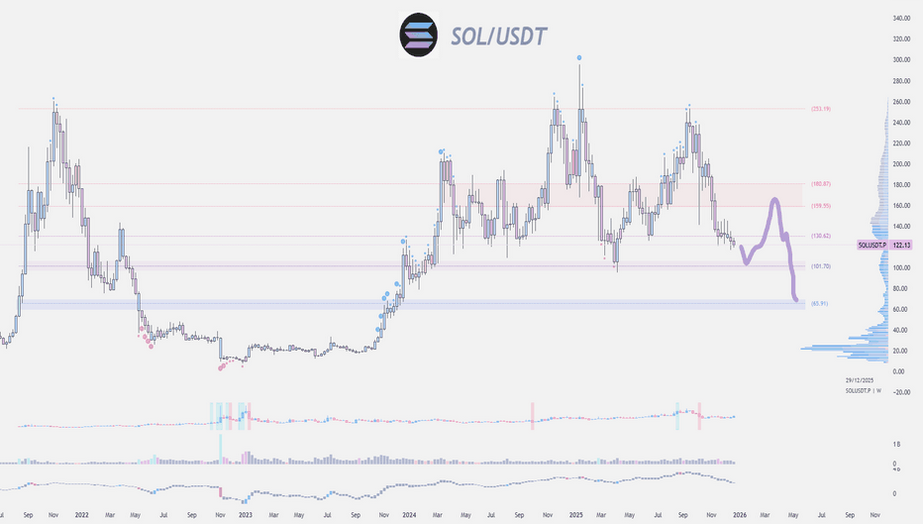
Solana has demonstrated relative strength by holding near its 20-day EMA around $126 over several consecutive sessions. This behavior suggests persistent buying interest, even as broader market sentiment remains cautious.
If SOL closes decisively above the 20-day EMA, it could rally toward the immediate resistance at $147. Although the 50-day SMA near $132 may offer minor resistance, the overall structure suggests a higher probability of continuation rather than rejection.
On the bearish side, a failure to hold the moving averages would indicate that sellers are regaining control. In that case, SOL could decline toward $108, with a more severe scenario involving a retest of the critical support near $95.
Solana’s importance extends beyond price action. Its ecosystem continues to attract developers due to high throughput and low transaction costs. Sustained technical strength in SOL often correlates with increased on-chain experimentation, new applications, and real-world blockchain adoption.
Conclusion: Navigating Opportunity in Volatility
The current correction phase across major cryptocurrencies highlights the importance of disciplined technical analysis. Bitcoin’s struggle around key moving averages will likely dictate overall market tone, while Ethereum’s compression hints at an imminent volatility expansion. XRP presents a high-risk inflection point, and Solana continues to stand out for its relative resilience.
For readers searching for new crypto assets, future revenue streams, or practical blockchain applications, these support and resistance levels offer more than trading signals—they provide a framework for timing investment, development, and strategic decisions.
In volatile markets, opportunity often emerges not from prediction, but from preparation. Understanding where the market is most likely to stabilize allows investors and builders alike to act with clarity rather than emotion.
