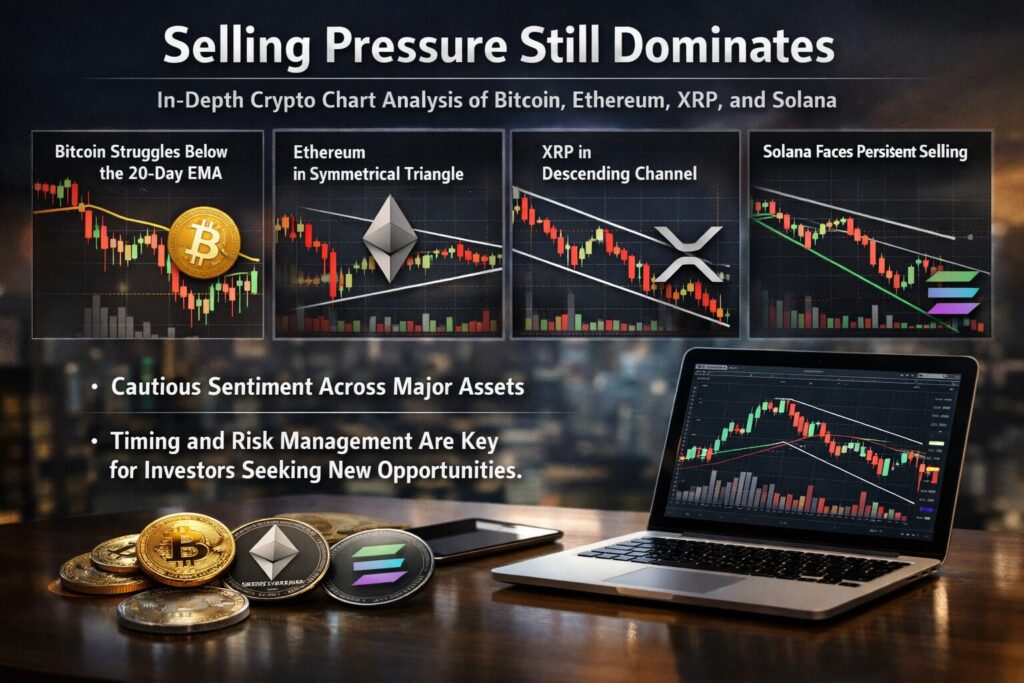
Main Points :
- Bitcoin is struggling to reclaim short-term momentum, with sellers defending levels above the 20-day EMA.
- Ethereum remains trapped within a symmetrical triangle, signaling compression before a decisive move.
- XRP continues to respect a descending channel, keeping downside risks elevated.
- Solana shows persistent selling on every rally, highlighting weak short-term confidence.
- Across major assets, markets suggest caution rather than aggressive accumulation.
- For investors seeking new revenue opportunities, timing and risk management are becoming more important than directional conviction.
Introduction: A Market Still Dominated by Caution
The cryptocurrency market continues to navigate a phase where selling pressure outweighs bullish conviction. Despite periodic rebounds and technical bounces, the broader structure across major digital assets suggests hesitation among buyers and persistent defense by sellers at key resistance levels.
This environment is particularly important for investors and builders who are searching not only for price appreciation but also for practical blockchain applications and sustainable revenue models. Understanding the technical posture of flagship assets such as Bitcoin, Ethereum, XRP, and Solana offers insight into whether the market is preparing for recovery—or merely pausing before another leg downward.
In this article, we expand on the referenced chart analysis, incorporate recent global crypto trends, and frame the implications for market participants seeking opportunity amid uncertainty.
Bitcoin Price Outlook: Range-Bound or Breakdown Ahead?
[Bitcoin daily chart showing 20-day EMA, key support at $84,000, and resistance near $94,500]
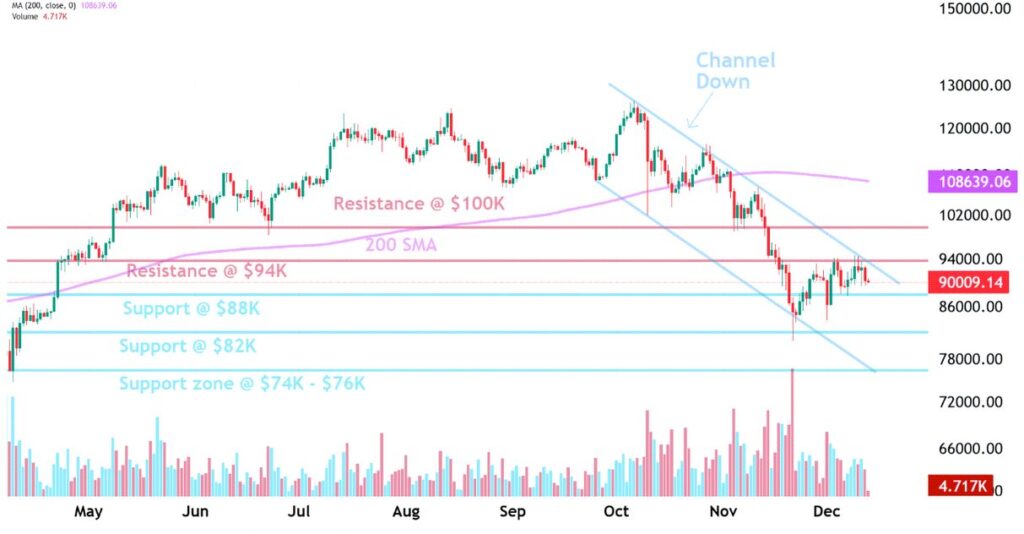
Bitcoin attempted a short-term recovery earlier this week when buyers pushed the price above the 20-day exponential moving average (EMA) around $88,850. However, the appearance of a long upper wick on the daily candle indicates that sellers quickly emerged at higher levels, preventing a sustained breakout.
This behavior reflects a familiar pattern in the current market: rallies are being sold rather than accumulated.
Key Support and Resistance Levels
From a technical perspective, bearish participants are likely targeting the $84,000 support zone, which represents a critical area where buyers may attempt to defend the trend. If Bitcoin rebounds strongly from this level and reclaims the 20-day EMA, the market could transition into a sideways consolidation range.
Under such conditions, Bitcoin may trade between $84,000 and $94,589 for an extended period, frustrating both bulls and bears while volatility compresses.
Downside Risk Scenario
Conversely, a decisive break below $84,000 would signal renewed downside momentum. In that case, Bitcoin could slide toward $80,600, and potentially as low as $74,508, a level that has historically attracted strong buying interest.
For investors seeking new crypto assets or yield strategies, this suggests that patience and staged entry strategies may be more effective than chasing momentum.
Ethereum Price Outlook: Compression Within a Symmetrical Triangle
[Ethereum daily chart highlighting symmetrical triangle, 20-day EMA, and 50-day SMA]
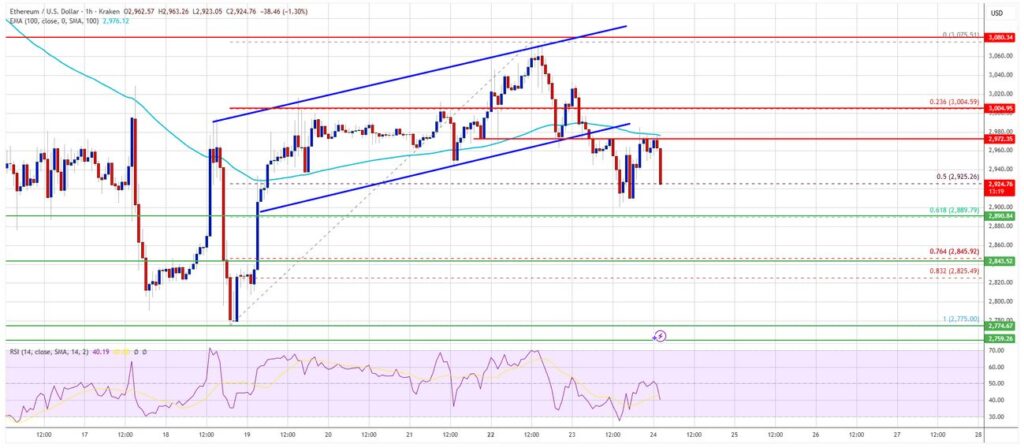
Ethereum managed to push above its 20-day EMA near $3,010, but bullish momentum stalled once price approached the 50-day simple moving average (SMA) around $3,088. This rejection underscores the market’s reluctance to price in aggressive upside expectations.
The Triangle Pattern and Its Implications
The ETH chart is currently dominated by a symmetrical triangle, a pattern that reflects balance—and indecision—between buyers and sellers. Bears are expected to pressure price toward the lower boundary of this triangle.
If Ethereum breaks below the support line, the ETH/USDT pair could decline toward $2,623, and possibly further to $2,373.
Bullish Alternative Scenario
On the other hand, a strong rebound from the support line followed by a move above the moving averages would indicate that Ethereum remains range-bound within the triangle. A daily close above the triangle’s resistance line would be a decisive signal that buyers are regaining control.
For developers and investors focused on Ethereum’s ecosystem—DeFi, staking, and Layer-2 scaling—this compression phase may precede a structural shift rather than a short-lived price spike.
XRP Price Outlook: Bears Maintain Control Within a Descending Channel
[XRP daily chart showing descending channel and key support levels]
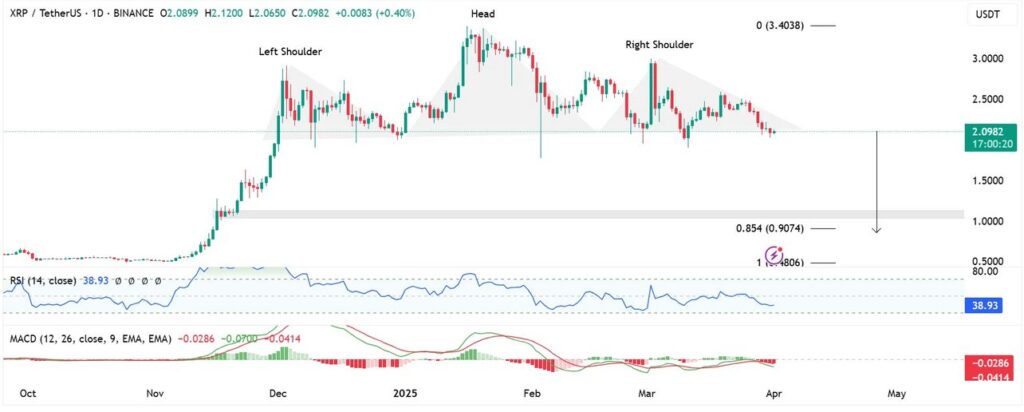
XRP has resumed its decline toward the support line of a descending channel, confirming that bearish forces remain dominant in the near term.
Critical Support Zones
The $1.61 level is expected to attract defensive buying. However, if sellers overpower this zone, XRP could experience a sharp drop toward $1.25, corresponding to the October 10 low.
This risk profile highlights why XRP, despite its strong use-case narrative in cross-border payments, continues to face speculative pressure tied to market structure rather than fundamentals alone.
Conditions for Trend Reversal
A rebound from the channel support followed by a move above the moving averages would likely keep XRP trading within the channel. A more meaningful shift would require a daily close above the descending trendline, which could open the door to a rally toward $3.10.
Until then, XRP remains a market primarily suited for range-based strategies rather than trend-following accumulation.
Solana Price Outlook: Persistent Selling on Every Rally
[Solana daily chart with 20-day EMA, support at $116 and $95]
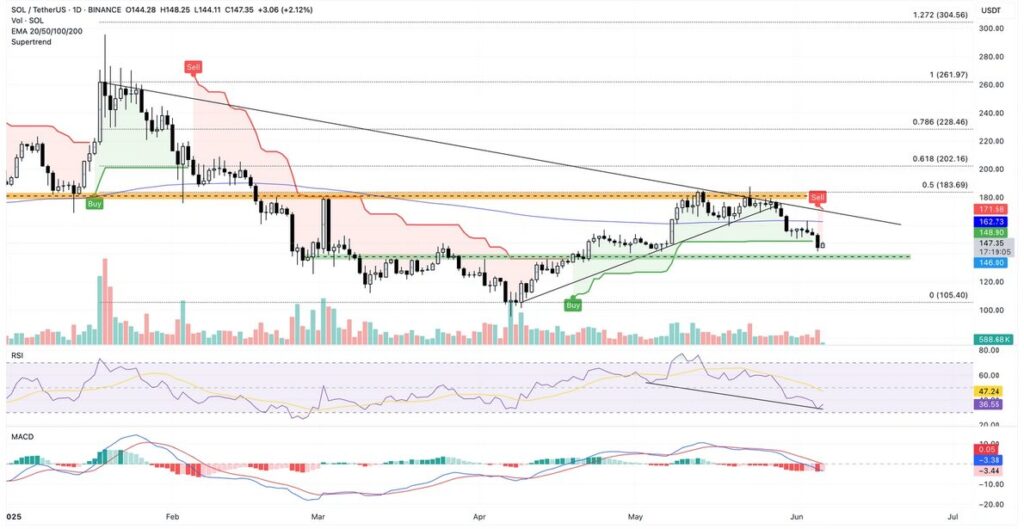
Solana’s failure to reclaim the 20-day EMA near $128 signals that sellers are active at virtually every rebound attempt. This pattern suggests weak short-term confidence despite Solana’s strong developer ecosystem and growing adoption in high-throughput applications.
Downside Risk
If the SOL/USDT pair breaks below $116, the next support lies at $108, followed by a more critical level at $95. This zone is likely to attract buyers looking for value-based entries.
Upside Requirements
For sentiment to shift, bulls must push Solana above its moving averages. A break above $147 would indicate a short-term trend reversal, potentially allowing price to advance toward $172.
For investors exploring Solana-based projects, this technical weakness reinforces the importance of separating network fundamentals from token price cycles.
Broader Market Context: Why Selling Pressure Persists
Beyond individual charts, several macro and industry-specific factors continue to weigh on crypto markets:
- Higher global interest rates reduce speculative capital flows.
- Regulatory uncertainty in major jurisdictions discourages aggressive positioning.
- Institutional investors increasingly demand clearer yield models and compliance frameworks.
- Retail participation remains cautious after prior volatility cycles.
At the same time, blockchain adoption continues quietly in areas such as payments, tokenization, and on-chain settlement, suggesting a divergence between price action and real-world utility growth.
Strategic Implications for Investors and Builders
For readers seeking new crypto assets and sustainable revenue opportunities, the current environment favors:
- Gradual accumulation rather than lump-sum entries.
- Focus on assets with strong ecosystems and real usage.
- Yield-generating strategies that do not rely solely on price appreciation.
- Risk-managed trading approaches within defined technical ranges.
This phase may ultimately reward those who prioritize structure and execution over speculation.
Conclusion: Caution Prevails, Opportunity Requires Discipline
Across Bitcoin, Ethereum, XRP, and Solana, the charts consistently show that selling pressure remains dominant. While bullish scenarios exist, they require confirmation through decisive breaks above resistance levels.
For now, the market appears to be consolidating rather than preparing for an immediate breakout. For investors and practitioners in the blockchain space, this period offers not hype—but clarity: success will depend on disciplined strategy, technical awareness, and alignment with long-term utility rather than short-term price excitement.
