<Market Analysis> **Selling Pressure at Resistance Levels : Crypto Technical Outlook for Bitcoin, Ethereum, XRP, and Solana**
Main Points :
- Major cryptocurrencies are facing selling pressure at critical resistance levels, signaling a market in consolidation rather than clear trend continuation.
- Bitcoin (BTC) remains range-bound, with strong support near the 20-day EMA and upside potential toward the psychologically important $100,000 level.
- Ethereum (ETH) experienced a failed breakout from a symmetrical triangle, raising the risk of a bull trap if key support levels fail.
- XRP shows early signs of a potential trend reversal, supported by bullish moving averages and RSI positioning.
- Solana (SOL) continues to attract buyers on dips, suggesting a gradual sentiment shift from “sell the rally” to “buy the dip.”
- For investors and builders, the current environment favors selective accumulation, disciplined risk management, and attention to on-chain and ecosystem fundamentals, not just price action.
Introduction: A Market Pausing at Resistance
The cryptocurrency market has entered a familiar yet critical phase: prices are stalling at resistance levels after a strong recovery, and traders are reassessing whether the next move will be continuation or correction.
Bitcoin, Ethereum, XRP, and Solana — four assets that collectively represent a large portion of total crypto market capitalization and developer activity — are all showing technically significant patterns. These patterns suggest hesitation rather than outright weakness, but they also warn against excessive optimism in the near term.
Beyond short-term trading implications, these technical setups matter for a broader audience: investors looking for the next growth cycle, institutions assessing allocation timing, and builders evaluating when market sentiment may again support risk-on innovation.
Bitcoin (BTC): Range-Bound, but Structurally Strong
[Bitcoin daily chart with 20-day EMA and resistance levels]
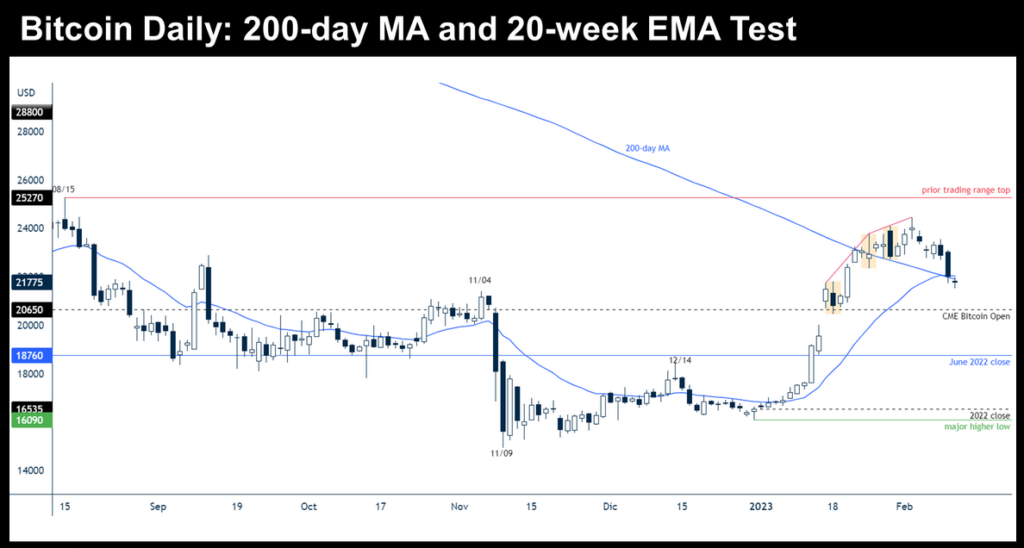
Bitcoin (BTC) recently pulled back from $94,789, signaling that sellers remain active near the upper boundary of its current trading range. This rejection highlights the ongoing struggle between bulls attempting to extend the rally and bears determined to keep prices capped.
From a technical perspective, the 20-day exponential moving average (EMA), currently near $90,022, remains a key level to watch. As long as BTC continues to find support near this EMA, the broader bullish structure remains intact.
A strong rebound from the 20-day EMA would increase the probability of a breakout above the $94,589 resistance. If that level is decisively cleared, Bitcoin could target the psychological $100,000 mark, followed by a potential extension toward $107,500.
However, downside risks remain. A sustained move below the moving averages would suggest prolonged consolidation. A break below $84,000 would likely signal that sellers have regained control, potentially triggering a deeper corrective phase.
Strategic Insight:
For long-term investors, Bitcoin’s current structure still favors accumulation on weakness rather than chasing breakouts. For infrastructure builders and institutions, BTC’s resilience reinforces its role as the core collateral and settlement asset of the crypto ecosystem.
Ethereum (ETH): Breakout Failure Raises Caution
[Ethereum daily chart with symmetrical triangle pattern]
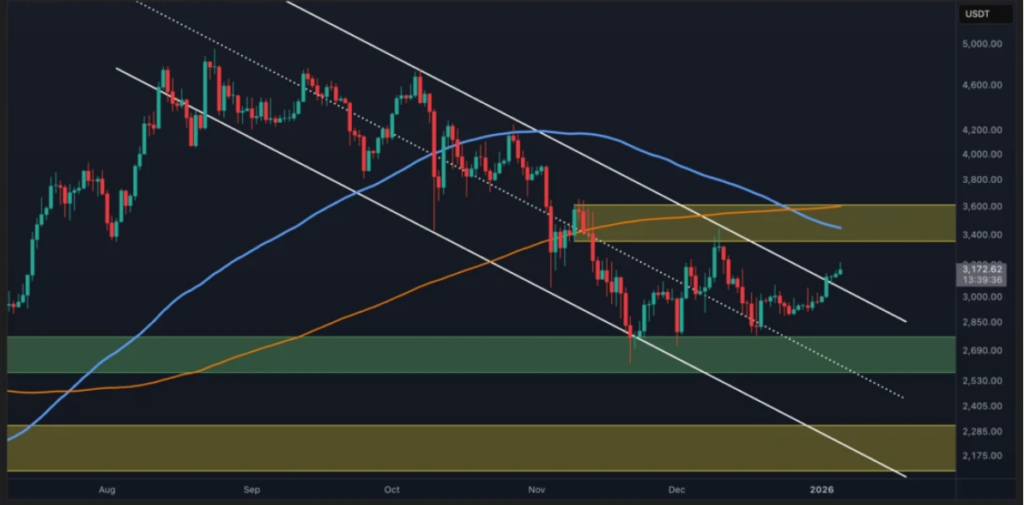
Ethereum (ETH) briefly broke above the resistance line of a symmetrical triangle but failed to hold higher levels — a classic warning sign for traders. The price has since fallen back into the triangle, shifting attention to the moving averages as immediate support.
If ETH finds buyers near the moving averages and rebounds decisively, the ETH/USD pair could rally toward $3,659, with $4,000 as the next major psychological target. Such a move would likely require renewed confidence in Ethereum’s ecosystem growth, including Layer 2 adoption, restaking, and institutional usage.
On the downside, a breakdown below the triangle’s support line would suggest that the recent breakout was a bull trap. In that scenario, ETH could fall sharply toward $2,623, and in a more severe case, $2,111.
Strategic Insight:
Ethereum’s price action reflects a broader narrative tension: strong long-term fundamentals versus short-term uncertainty. Builders focused on DeFi, tokenization, and enterprise blockchain should view volatility as structural noise rather than a thesis-breaking signal.
XRP: Early Signals of a Trend Shift
[XRP daily chart with descending channel and RSI]
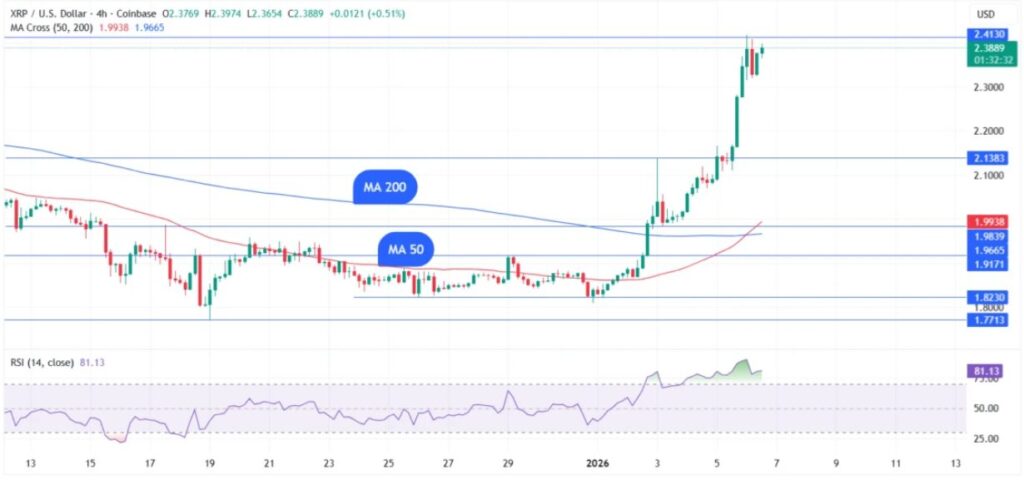
XRP recently approached the descending trendline of a falling channel — a level that historically acts as strong resistance. However, technical indicators are starting to favor the bulls.
The moving averages are close to forming a bullish crossover, and the Relative Strength Index (RSI) is holding in positive territory. If buyers manage to push XRP above the downtrend line and secure a daily close, it would suggest a short-term trend reversal. In that case, XRP could rally toward $2.70.
On pullbacks, the moving averages are expected to act as solid support. If sellers manage to push the price back below these levels, XRP may remain confined within the descending channel for several more days.
Strategic Insight:
XRP’s technical structure is particularly relevant for payment-focused blockchain use cases. Any sustained breakout would reinforce narratives around cross-border settlement, liquidity provisioning, and institutional corridors.
Solana (SOL): From Selling Rallies to Buying Dips
[Solana daily chart with resistance and moving averages]
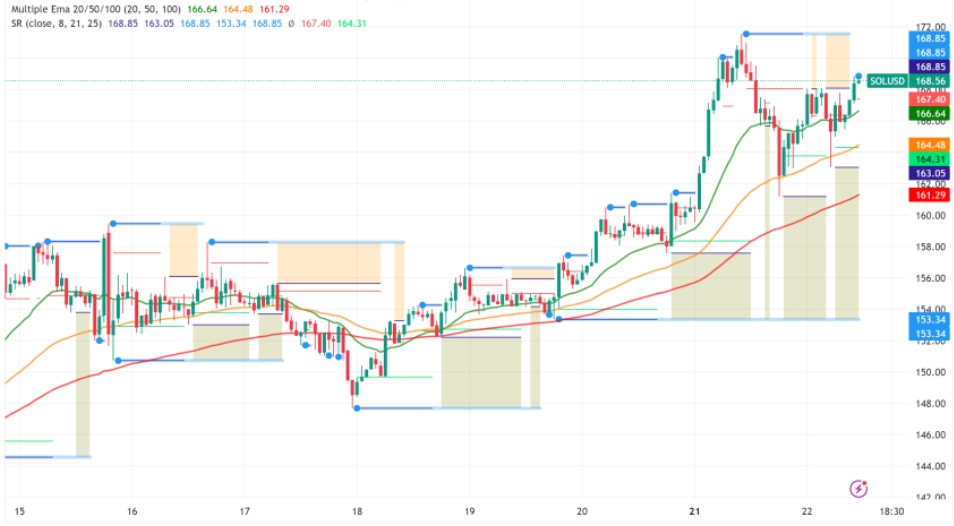
Solana (SOL) has encountered selling pressure near $147, but notably, bears have failed to push the price significantly lower. This behavior suggests growing confidence among buyers.
A rebound from the moving averages would indicate a sentiment shift from “sell the rally” to “buy the dip.” Such a shift would increase the likelihood of a breakout above $147, opening the door for a move toward $172.
Conversely, a breakdown below the moving averages would imply that bullish momentum is fading. In that case, SOL could decline toward $116. A strong rebound from that level would suggest the formation of a short-term range.
Strategic Insight:
Solana’s ecosystem momentum — spanning DePIN, consumer apps, and high-throughput financial infrastructure — continues to attract developers. Price consolidation may ultimately serve as a base for the next expansion phase.
Broader Market Context: What Investors Should Watch
Across all four assets, the common theme is consolidation at resistance rather than outright reversal. This suggests that the market is digesting gains while awaiting new catalysts.
Key factors to monitor include:
- Macro conditions and U.S. dollar liquidity
- ETF and institutional flow data
- On-chain activity and real user growth
- Regulatory clarity and jurisdictional arbitrage opportunities
For those seeking new revenue opportunities, periods like this often reward patience, selective positioning, and operational readiness rather than aggressive speculation.
Conclusion: A Market Resetting, Not Breaking
The current technical landscape for Bitcoin, Ethereum, XRP, and Solana points to a market that is pausing, not collapsing. Resistance levels are doing their job, but support zones remain intact.
For investors, this environment favors disciplined accumulation and scenario-based planning. For builders and operators, it is a reminder that long-term value creation in crypto is driven as much by infrastructure, compliance, and usability as by price.
If resistance levels eventually give way, the next leg higher could be powerful. Until then, the smartest strategy may be to prepare rather than predict.
