Main Points :
- Buyers are showing signs of strength, but key resistances remain in place.
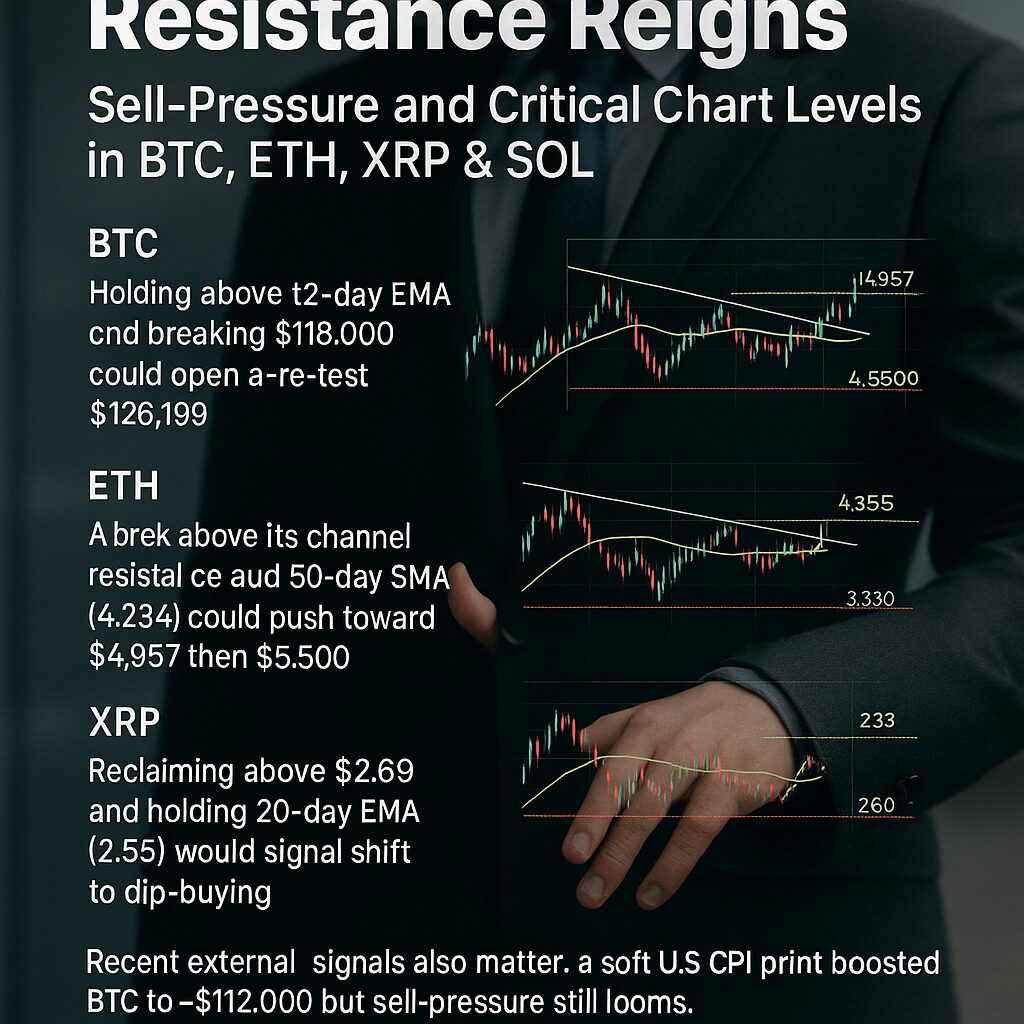
- For Bitcoin (BTC), holding above the 20-day EMA and breaking $118,000 could open a re-test of $126,199.
- For Ethereum (ETH), a break above its channel resistance and the 50-day SMA ($4,234) could push toward $4,957 then $5,500; failure risks a slide toward $3,350.
- For XRP, reclaiming above $2.69 and holding the 20-day EMA ($2.55) would signal shift to dip-buying; failure may drag toward $2.32.
- For Solana (SOL), clearing above its 20-day EMA ($197) opens path to $238 and $260, but a reversal would keep it in the descending channel.
- Recent external signals also matter: a soft U.S. CPI print boosted BTC to ~$112,000 but sell-pressure still looms.
- Market breadth suggests altcoins may be gearing up for a rotation as BTC dominance weakens.
1. Bitcoin: Under Pressure but Showing Signs of Life
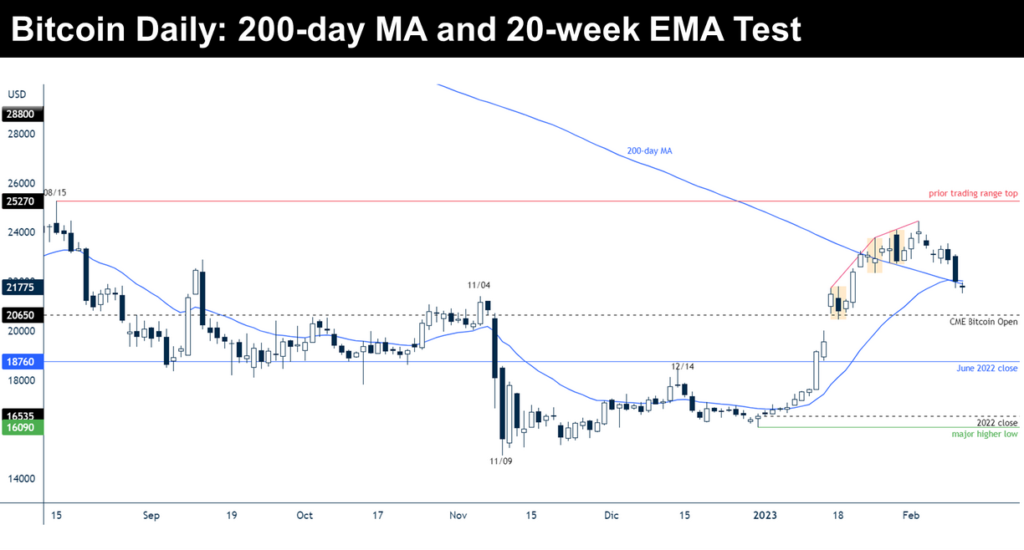
In the recent analysis, Bitcoin’s price action is telling a story of conflicted momentum. On one hand, it has climbed back above the 20-day EMA (≈ $112,337) and the RSI has moved into positive territory — signals that the bulls are reasserting some control. That said, the bear camp is clearly still active, with substantial sell side pressure visible whenever rallies attempt to accelerate.
The key threshold to pace the next move is around $118,000: a successful break above this could set up a retest of the all-time high of $126,199. However, if weakening occurs and BTC closes back below the 20-day EMA, or slips beneath the $107,000 support, then the bears may regain control, and the next low may test nearer to $100,000.
From a trading/investment perspective for readers looking for new crypto assets or income opportunities: this is a pivotal juncture. If you believe in a breakout scenario, establishing or adding exposure near strong supports (e.g., $107k–$110k) may present opportunity. Conversely, one must guard against a false breakout and be ready for a drop if support fails.
Key metrics:
- 20-day EMA: ~$112,337.
- Resistance: ~$118,000 then retest of $126,199.
- Support risk: ~$107,000 and potentially ~$100,000.
Given macro tailwinds — notably a favourable CPI print that spurred a push toward ~$112,000. — the environment is receptive, yet order-book liquidity remains thin and sell-side defendances are evident.
2. Ethereum: Channel Bound, Awaiting Breakout or Breakdown
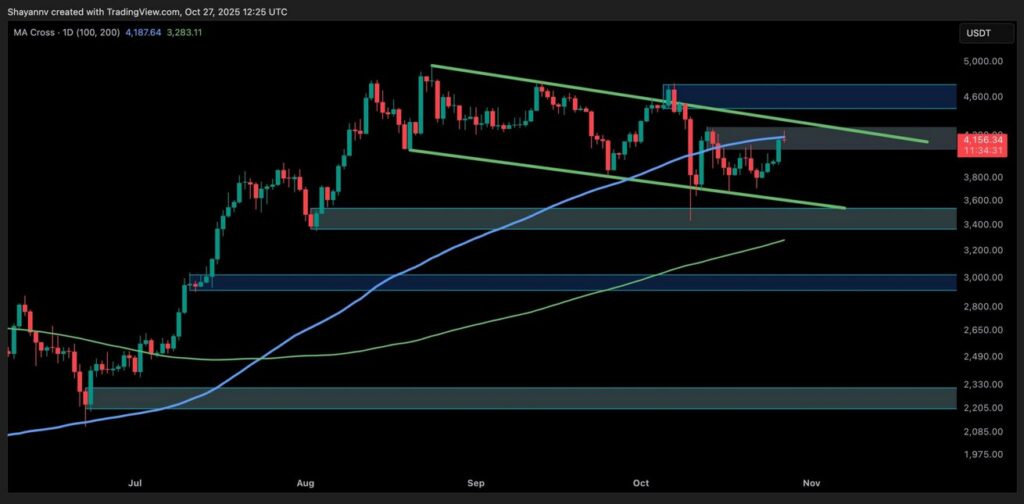
Ethereum stands in a somewhat similar position, albeit with slightly more structural risk. The price closed above its 20-day EMA (≈ $4,047) which signals reduced immediate selling pressure. The primary battlefield now becomes the 50-day SMA (~$4,234) and the upper boundary of the descending channel pattern. If bulls can conquer these, there’s a pathway up to ~$4,957 and potentially ~$5,500.
However — if sellers trap the price beneath resistance and drive a break below the channel’s support, the drop toward ~$3,350 becomes a real possibility. For practitioners exploring blockchain applications, Ethereum remains a compelling ecosystem (smart contracts, dApps, DeFi) but from a price perspective, the risk/reward is tighter than for Bitcoin.
Key metrics:
- Support: 20-day EMA (~$4,047)
- Resistance: 50-day SMA (~$4,234) + channel top → $4,957 then $5,500
- Breakdown risk: ~$3,350 if support fails
One bullish signal worth highlighting: recent on-chain data show large “whale” wallets (holding 100-10,000 ETH) beginning to accumulate after recent sell-off. This suggests seasoned holders may be positioning ahead of a move.
3. XRP: Testing the Shift from “Sell-the-Rally” to “Buy-the-Dip”
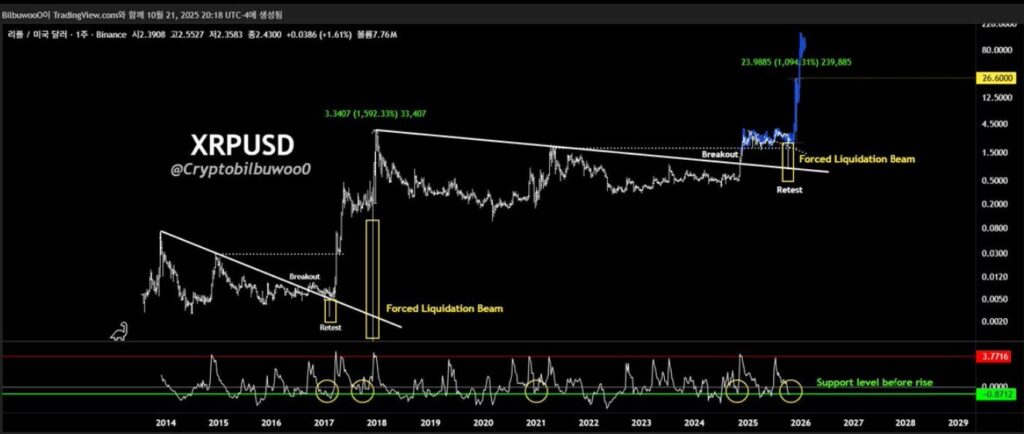
XRP has had a particularly interesting technical setup. Bulls managed to push the price above the 20-day EMA (~$2.55) and reached a key level of ~$2.69 — which is considered the breakdown threshold where the bears previously dominated.
If the price stalls at $2.69 but finds support above the 20-day EMA, then sentiment could shift from “sell-on-rallies” to “buy-on-dips”. That would open the potential for an advance toward the down-trend line and signal a possible trend reversal. Conversely, if XRP fails to hold above the 20-day EMA and drops below ~$2.32, then the corrective phase remains intact and sellers maintain the upper hand.
Key metrics:
- 20-day EMA: ~$2.55
- Break threshold: ~$2.69
- If bullish: then move toward down-trend line
- If bearish: potential move to ~$2.32
For investors seeking new assets: XRP’s pivot potential is worth watching — if the shift into accumulation takes hold, it could be a relative breakout among the major altcoins.
4. Solana: Channel Resistance Breached, Momentum Potential Emerging
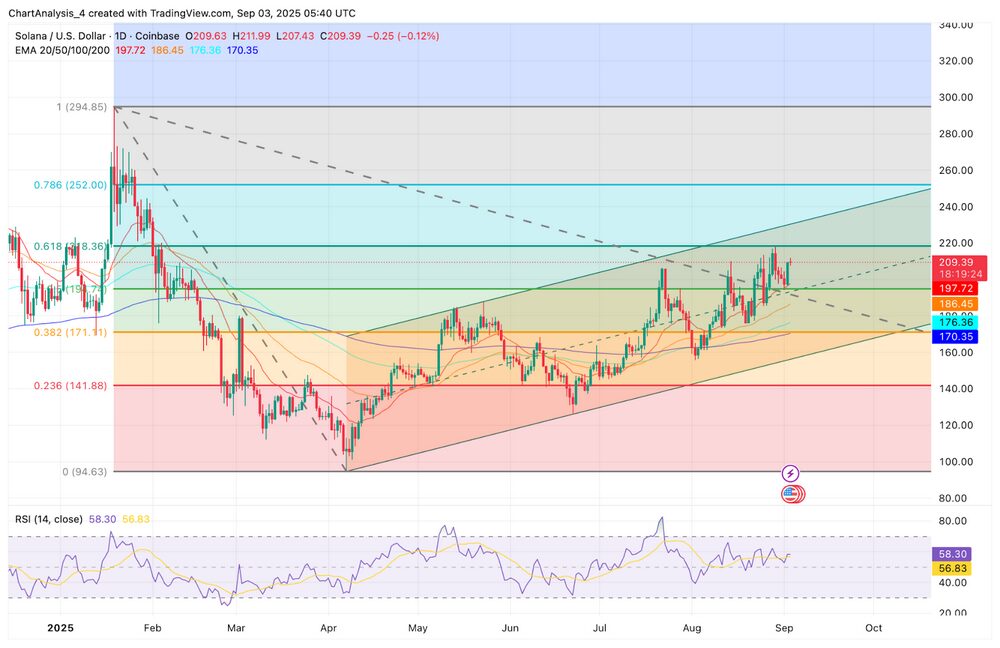
Solana appears to be one of the more opportunistic setups in this quartet. Recent analysis reports that SOL climbed above its 20-day EMA (~$197) and thereby cleared the immediate barrier to attempt a move toward the resistance line of the descending channel. If bulls can hold momentum, they target ~$238 and then ~$260.
However the caveat is clear: if SOL fails to push beyond the channel top and instead reverses and falls below the 20-day EMA, it may remain trapped within the channel for longer, limiting upside. Importantly, recent developments show Solana benefiting from broader themes (e.g., institutional flows, ETF approvals). For players interested in blockchain infrastructure or smart-contract platforms, Solana’s potential high-velocity network and ecosystem growth add a practical layer beyond pure price speculation.
Key metrics:
- Support: 20-day EMA (~$197)
- Upside target: ~$238 → ~$260
- Channel risk: if fails, may return toward ~$180 or lower
Given the broader narrative shift (see next section) where altcoins may be poised to re-take capital, Solana is possibly best positioned among the major altcoins discussed here.
5. Broader Market Context: Altcoins Gaining Relative Strength
Beyond the individual charts, the wider market context is showing meaningful signals:
- According to recent analysis, the dominance of Bitcoin is tracing a descending trendline — historically this has preceded altcoin-seasons where capital rotates from Bitcoin into altcoins.
- On-chain data show Ethereum whales accumulating again after previous sell-off periods, adding weight to the theory that large players are positioning for recovery.
- Macroeconomic tailwinds such as a softer U.S. CPI print have triggered risk-asset strength including crypto. For example, Bitcoin spiked to ~$112,000 as inflation data came in cooler than expected.
For readers looking to identify new crypto assets or next-generation revenue streams, this context suggests two strategic themes:
- Rotation theme: If altcoins are about to outperform, assets like Solana or XRP (with strong setups) may present relatively higher upside — especially if Bitcoin stalls.
- Macro/structural tailwinds: Keep an eye not only on chart patterns but also on institutional flows, ETF developments, and large-wallet behavior — these add practical substance to the speculative thesis.
Conclusion: Navigating Resistance and Opportunity
The technical landscape of major crypto-assets is currently at a crossroads. While buyers are showing renewed strength, significant resistances remain and the risk of false breakouts or abrupt reversals is real. For BTC, ETH, XRP and SOL, the next few weeks may determine whether these assets break into meaningful up-trends or revert to consolidation or correction.
For investors and developers focused on new crypto assets, revenue streams, and practical blockchain applications, the key takeaway is this: Monitor structural setups and ecosystem tailwinds, but respect key support/resistance thresholds.
- If BTC breaks above ~$118,000 and holds, the door opens for upside.
- If ETH clears its channel resistance, a larger leg up may follow.
- XRP’s shift from “sell the rally” to “buy the dip” could mark a turning point.
- Solana may be the best positioned among the altcoins for an upside breakout.
However, if support levels give way, the path of least resistance may point lower — and risk management remains essential. In the current environment, assets with strong utility, ecosystem growth, and accumulation signals may outperform purely momentum-based ones.
In summary: this phase is less about blind speculation and more about selective thesis-driven exposure, using chart mechanics, on-chain signals, and macro context as your guide. Keep the resistances in view, stay ready for either breakout or breakdown, and align your blockchain-application and investment thinking accordingly.
