
Main Points :
- Bitcoin is currently in a range-bound adjustment phase where time-based liquidity matters more than absolute price levels.
- Volatility and directional moves are concentrated from Tuesday to Wednesday, while Saturdays consistently show suppressed price action.
- On-chain and derivatives data indicate neutral supply-demand conditions, limiting the likelihood of sudden trend emergence.
- For investors and builders, understanding when Bitcoin moves is becoming as important as understanding why it moves.
1. Bitcoin Has Entered a “Time-Reading” Market Phase
The current Bitcoin market cannot be cleanly classified as either the early stage of a bull market or a clear continuation of a bear market. Instead, it is best described as a range-based adjustment phase, where price oscillates within defined boundaries without committing to a sustained directional trend.
What distinguishes this phase from past consolidation periods is that price level alone no longer explains market behavior. Instead, the timing of liquidity—specifically, which days of the week and which time windows attract meaningful participation—has become the dominant driver of price action.
From a conditional perspective, the market bias remains neutral to mildly bullish. However, the more actionable insight lies not in asking “Is Bitcoin bullish or bearish?” but rather “When does Bitcoin actually move?”
2. Weekday Price Action: Volatility Is a Function of the Calendar
Analysis of Price Action by Day of the Week reveals a clear and persistent structural pattern:
- Tuesday to Wednesday:
Volatility consistently increases, and short-term directional trends are more likely to form. - Saturday:
Price ranges compress sharply, and directional conviction almost disappears.
This is not a one-off anomaly. The same weekday-dependent structure has been observed across multiple market cycles and timeframes, suggesting a stable behavioral feature rather than a temporary distortion.
Normalized Bitcoin Volatility by Day of the Week
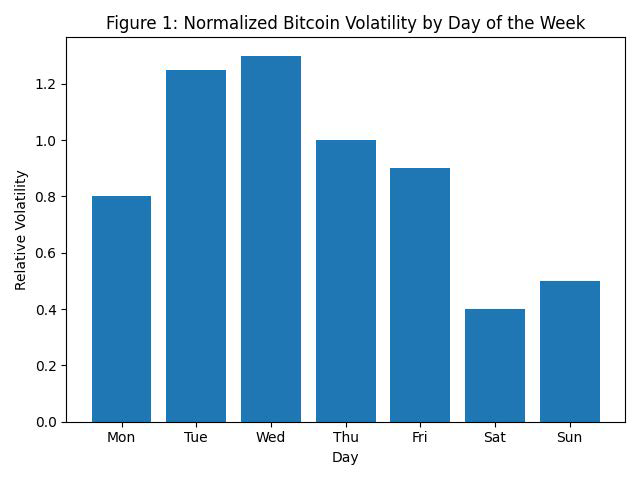
This chart illustrates how relative volatility peaks mid-week and collapses over the weekend, especially on Saturdays.
3. Intraday Behavior Confirms the Weekend Liquidity Hypothesis
Lower-timeframe price data further reinforces this conclusion. On Saturdays, Bitcoin still experiences frequent micro-movements—small up-and-down fluctuations—but these moves rarely extend into sustained directional sequences.
Instead, price action is characterized by:
- Short-lived rebounds
- Immediate retracements
- Repeated mean reversion within a narrow range
Importantly, this behavior is not primarily driven by technical resistance or support levels. Rather, it reflects the composition of market participants active during the weekend.
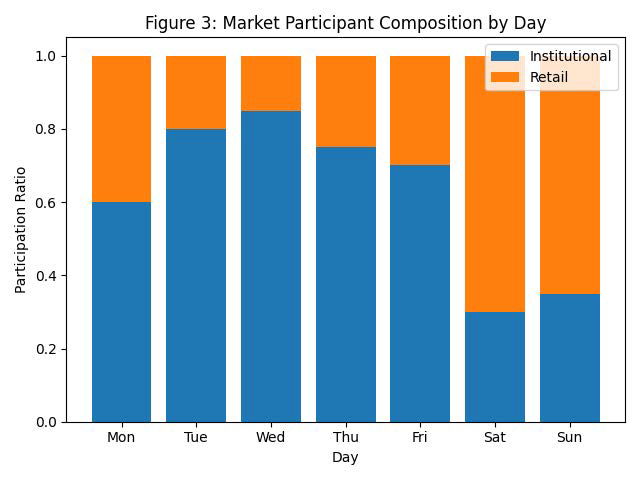
4. Why Saturdays Don’t Trend: Participant Quality Matters More Than Volume
The key reason Bitcoin struggles to trend on Saturdays is not a collapse in demand or supply, but a change in who is trading.
During weekends:
- Institutional investors largely step away
- Arbitrage desks reduce activity
- Macro-driven short-term capital exits the market
As a result:
- Order books become thinner
- Trading volume declines
- But crucially, large new directional flows also disappear
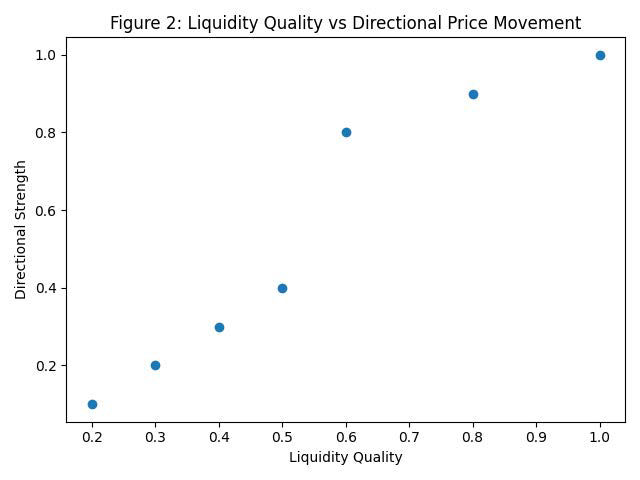
Liquidity still exists, but it lacks the force needed to push price decisively in one direction. Without participants capable of committing sustained capital, price remains trapped in a narrow equilibrium.
5. On-Chain Data Confirms Structural Neutrality
On-chain indicators strongly support this interpretation.
Key observations include:
- No sharp increase in exchange balances, indicating the absence of panic selling or large-scale distribution.
- Stable long-term holder behavior, with no significant spike in realized losses.
- Futures market leverage remains near neutral, reducing the probability of liquidation-driven volatility.
Despite lower weekend liquidity, price stability persists. This paradox—thin liquidity without breakdown—is a hallmark of a market that is not preparing for an immediate trend shift.
6. Mid-Week Windows: Where Structure Can Break
In contrast, Tuesday through Wednesday consistently emerge as the market’s most sensitive time windows.
During these periods:
- Positions accumulated early in the week are adjusted
- Institutional participants re-enter
- Arbitrage and basis trades resume
- On-chain flows and futures open interest often shift simultaneously
When Bitcoin does break out of a range, it is statistically far more likely to do so during these mid-week sessions. Directional conviction, when it appears, is rarely born on weekends.
7. The Exception Scenario: When the Calendar Stops Working
There is, however, a clear invalidation condition for this weekday-based framework.
If, even during a weekend:
- Large-scale inflows to exchanges are detected, and
- Futures leverage expands rapidly at the same time,
Then the usual liquidity assumptions collapse. Under such circumstances, price can move aggressively regardless of the day.
At present, no such signals are visible.
8. How to Read On-Chain Indicators in a Time-Based Market
In the current environment, weekday price action should be treated as a structural filter for interpreting on-chain data.
- When volatility expands mid-week and on-chain flows shift, structural change is likely underway.
- When weekend price ranges compress and on-chain metrics remain stable, range continuation is the default assumption.
This approach allows investors and builders to distinguish between noise and structural transition more effectively.
9. Implications for Investors, Builders, and Yield Seekers
For those searching for:
- New crypto assets
- The next revenue opportunity
- Practical blockchain use cases
The key takeaway is this:
Market timing is becoming a first-class analytical dimension.
Strategy implications include:
- Avoid over-interpreting weekend price moves
- Focus risk deployment around mid-week liquidity windows
- Align on-chain monitoring with temporal market structure
- Design trading, treasury, and hedging systems that respect liquidity timing
Conclusion: Bitcoin Is Teaching the Market to Read Time
Bitcoin’s current market structure suggests a subtle but profound evolution. Price still matters—but time now matters just as much.
By understanding when liquidity concentrates, who participates during those windows, and how on-chain signals align with calendar-driven behavior, market participants gain a sharper, more durable edge.
In this phase, Bitcoin is less about predicting the next breakout price—and more about recognizing the precise moment when the market is capable of moving at all.
