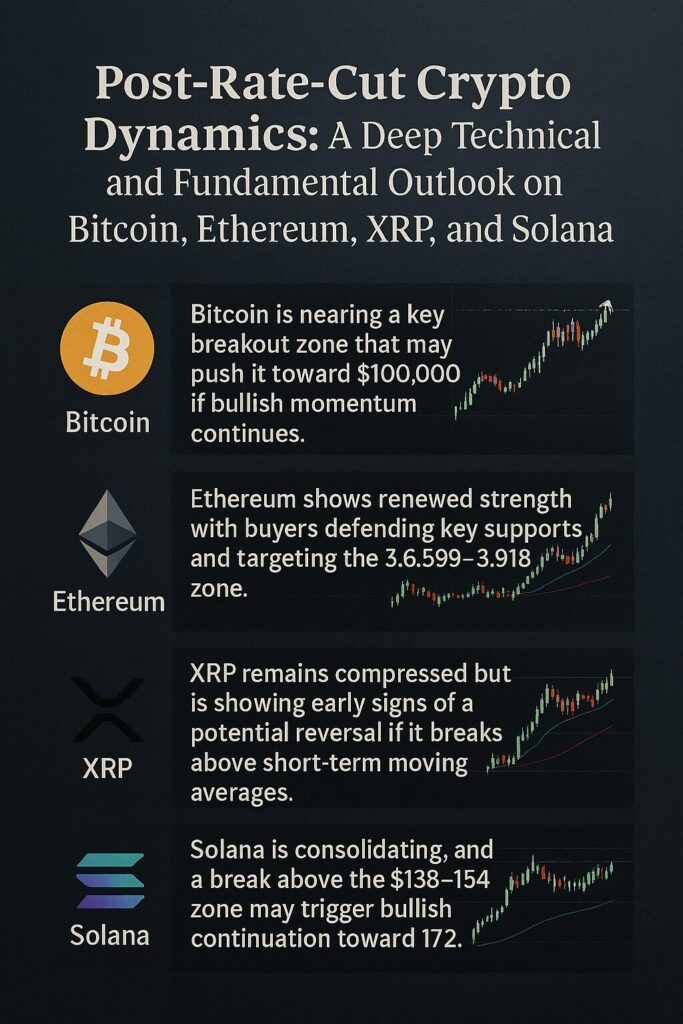
Main Points :
- Bitcoin is nearing a key breakout zone that may push it toward $100,000 if bullish momentum continues.
- Ethereum shows renewed strength with buyers defending key supports and targeting the $3,659–$3,918 zone.
- XRP remains compressed but is showing early signs of a potential reversal if it breaks above short-term moving averages.
- Solana is consolidating, and a break above the $138–$154 zone may trigger bullish continuation toward $172.
Introduction
The recent global rate-cut cycle has reshaped financial markets, and crypto assets have reacted with notable volatility followed by renewed directional trends. Lower interest rates traditionally improve liquidity and risk appetite, which historically benefits digital assets. However, market structure, technical patterns, and macro uncertainty create mixed conditions requiring careful analysis.
This report synthesizes current chart structures for Bitcoin (BTC), Ethereum (ETH), XRP, and Solana (SOL), referencing the latest market behavior and integrating additional insights from external sources including on-chain analytics, derivatives data, and liquidity trends. For investors seeking new crypto opportunities or practical blockchain applications, understanding these movements is essential—especially as the next growth cycle approaches.
Bitcoin (BTC): Approaching the Breakout Threshold
Bitcoin recently closed above its 20-day Exponential Moving Average (EMA) at around $91,583. While bullish traders attempted to hold price above $94,150, the level acted as a strong resistance. The market is now positioned at a critical zone where a decisive breakout can re-establish the macro uptrend.
Technical Outlook
A daily close above $94,589 would signal a potential push toward the psychological barrier of $100,000. Historically, round numbers attract significant profit-taking and algorithmic resistance, meaning bears may attempt to defend this area aggressively. If Bitcoin manages to break above $100,000 with strong volume, the next target becomes $107,000, which aligns with previous long-term Fibonacci projections.
However, if bears regain control and BTC drops below $87,719, this indicates sellers are active during recovery attempts. A decline toward $83,822 would then become likely, marking a deeper correction before any renewed upward movement.
Macro and Derivatives Context
External data platforms such as Glassnode and Deribit indicate:
- Funding rates have normalized, suggesting balanced leverage rather than overheated speculation.
- Long-term holder supply sits near all-time highs, reflecting confidence in the next cycle.
- ETF inflows—particularly in the U.S. and Asia—have re-accelerated following the rate-cut announcement.
The interaction between ETF demand and reduced interest-rate pressure continues to frame Bitcoin as a superior speculative store of value compared to gold and bonds.
Ethereum (ETH): Strong Rebound with Higher Targets Ahead
Ethereum has shown renewed strength, rebounding sharply and retesting the critical breakdown level of $3,350. Buyers have demonstrated resilience at lower levels, indicating strong demand from both retail and institutional participants.
Technical Outlook
The 20-day EMA near $3,116 has begun turning upward, and the Relative Strength Index (RSI) has moved into positive territory—a classic signal that buyers are regaining dominance.
A daily close above $3,350 opens the door to the next resistance zones:
- $3,659
- $3,918
The upper level corresponds to a prior supply zone that rejected price earlier in the year.
If Ethereum slips below the 20-day EMA, bearish sentiment could return and force price downward, turning $3,350 into a resistance barrier once again. A decline toward $2,716 would become the next plausible downside target.
Fundamental Catalysts
Several developments outside the charts support ETH’s medium-term strength:
- Layer-2 expansion (Arbitrum, Optimism, Base) continues to grow transaction volume.
- Restaking protocols such as EigenLayer attract billions in deposits, increasing ETH’s economic utility.
- ETF expansion: Analysts expect more jurisdictions to approve ETH ETFs after the U.S., increasing global demand.
Ethereum remains a platform asset—its long-term value is tied to developer activity, network fees, and tokenized financial applications. Rate-cut environments typically stimulate risk-on development, benefiting ETH’s ecosystem.
XRP: Compressed but Showing Reversal Potential
XRP continues to trade below its 20-day EMA of roughly $2.12, but sellers have not succeeded in pushing price down to the descending channel’s support line. This indicates weakening bearish momentum.
Technical Outlook
If bulls successfully reclaim the 20-day EMA, XRP may next test:
- 50-day SMA near $2.26
- The descending trendline, which remains a major structural resistance
A strong breakout above these levels could shift momentum in favor of buyers, potentially setting up a mid-term trend reversal.
On the downside, losing support at $1.98 confirms that bears still dominate. In that case, XRP may fall toward the channel bottom and possibly $1.61, a major support historically associated with capitulation events.
Market Sentiment and Legal Overhang
Recent external developments continue to influence XRP:
- Ripple’s legal dispute with the U.S. SEC remains a headline risk but has stabilized.
- Asian markets, particularly Japan and the Philippines, show growing utility in remittance corridors—use cases that benefit XRP’s liquidity profile.
- On-chain metrics show suppressed volatility, meaning XRP may be nearing a period of expansion.
For investors exploring new diversification assets, XRP remains controversial but potentially rewarding if regulatory clarity improves.
Solana (SOL): Consolidation Before the Next Move
Solana has held above its 20-day EMA around $138, although bearish pressure remains present. Both the EMA’s flattening and the RSI hovering near the midpoint indicate a slowdown in bearish momentum.
Technical Outlook
For bulls to regain control, SOL must close decisively above the 20-day EMA. This could trigger a rally toward:
- $154 (50-day SMA)
- $172, a historical resistance cluster
If the market sentiment strengthens, Solana could reclaim its leadership position among high-performance smart-contract chains.
Conversely, a close below $126 would signal renewed bearish continuation, opening the path toward $110 and even $95, which remains a strong long-term support.
Fundamental Drivers
Solana continues to benefit from:
- Explosion of meme-coin trading activity
- Continued improvement of Solana’s runtime stability
- Institutional experimentation with high-speed settlement using Solana’s architecture
- Rising developer adoption thanks to low fees and fast block times
SOL remains one of the most vibrant ecosystems for early-stage investors seeking high-growth assets.
Comparative View and Broader Market Dynamics
Rate cuts historically increase liquidity, making long-duration assets such as crypto more attractive. The latest cycle mirrors previous conditions seen in 2020–2021, although the market is now more mature with ETFs, institutional custody, and stricter regulatory guidance.
Other current market trends include:
- Increased stablecoin issuance, especially USDC, which supports liquidity across exchanges
- Growing Bitcoin dominance, although ETH’s share is beginning to rise again
- Strengthening Asian trading hours, reflecting rising demand in Japan, Korea, and Southeast Asia
- Expansion of tokenized assets (RWA), one of the fastest-growing use-cases for blockchain in 2025
- AI + crypto convergence, where compute marketplaces and decentralized inference systems gain traction
Within this ecosystem, BTC, ETH, XRP, and SOL each represent different strategic positions:
| Asset | Primary Use Case | Risk Level | Key Watch Level |
|---|---|---|---|
| BTC | Store-of-value, ETF-driven | Medium | $94,589 / $100,000 |
| ETH | Smart-contract settlement | Medium | $3,350 / $3,918 |
| XRP | Remittance and liquidity rails | Medium-High | $2.26 / $1.98 |
| SOL | High-speed smart-contract network | High | $154 / $126 |
These indicators help investors allocate based on risk appetite and technological conviction.
Conclusion
The post-rate-cut environment appears favorable for crypto assets, but the path forward will depend on both technical confirmation and fundamental catalysts. Bitcoin’s approach to the $100,000 mark may dictate broader market sentiment, while Ethereum continues to rebuild upward momentum supported by expanding ecosystem demand.
XRP remains in a compressed range, awaiting a breakout or breakdown that will define its next major move. Solana shows signs of stabilization, with the potential to outperform if bullish conditions strengthen.
For investors seeking new opportunities, understanding each asset’s technical threshold and macro drivers provides a strategic advantage. As global liquidity expands, the next crypto growth cycle may already be forming beneath the surface.
