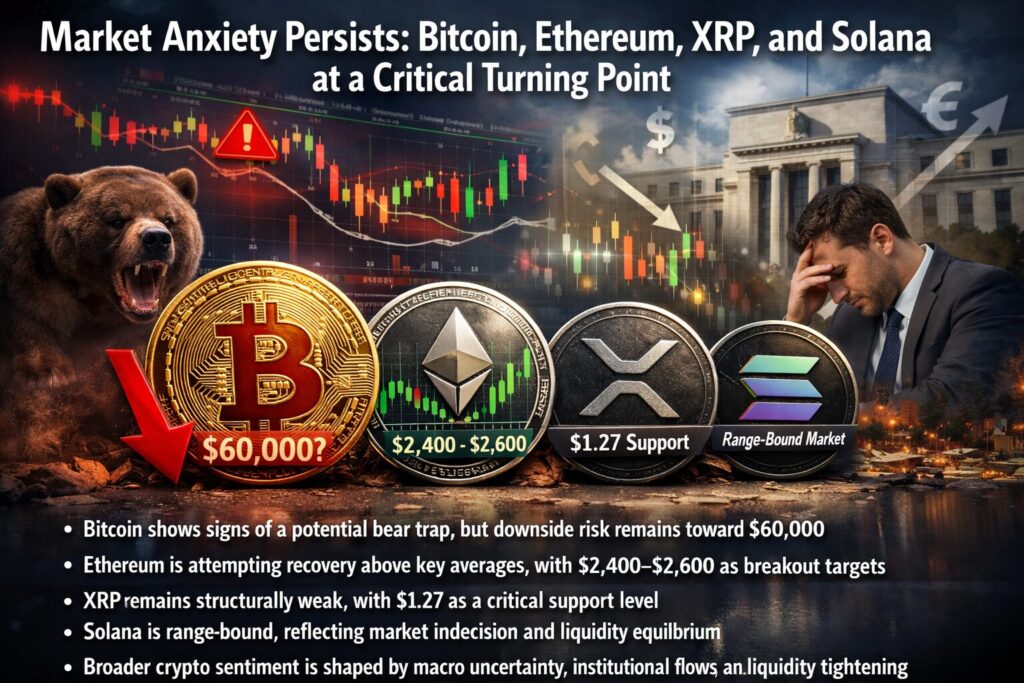
Key Takeaways :
- Bitcoin shows signs of a potential bear trap, but downside risk remains toward $60,000
- Ethereum is attempting recovery above key averages, with $2,400–$2,600 as breakout targets
- XRP remains structurally weak, with $1.27 as a critical support level
- Solana is range-bound, reflecting market indecision and liquidity equilibrium
- Broader crypto sentiment is shaped by macro uncertainty, institutional flows, and liquidity tightening
Introduction: A Market Defined by Uncertainty
The cryptocurrency market is currently navigating a delicate balance between recovery and renewed downside pressure. While recent price action across major assets such as Bitcoin, Ethereum, XRP, and Solana suggests resilience, underlying sentiment remains fragile. Traders are increasingly cautious, with macroeconomic uncertainty, institutional positioning, and liquidity conditions playing a decisive role in short-term price movements.
This analysis expands upon recent chart-based insights while integrating broader market developments. For investors seeking new opportunities, income strategies, or practical blockchain applications, understanding these technical and structural signals is critical.
Bitcoin: Bear Trap or Prelude to Deeper Correction?
BTC Price Structure (Ascending Triangle & Key Levels)
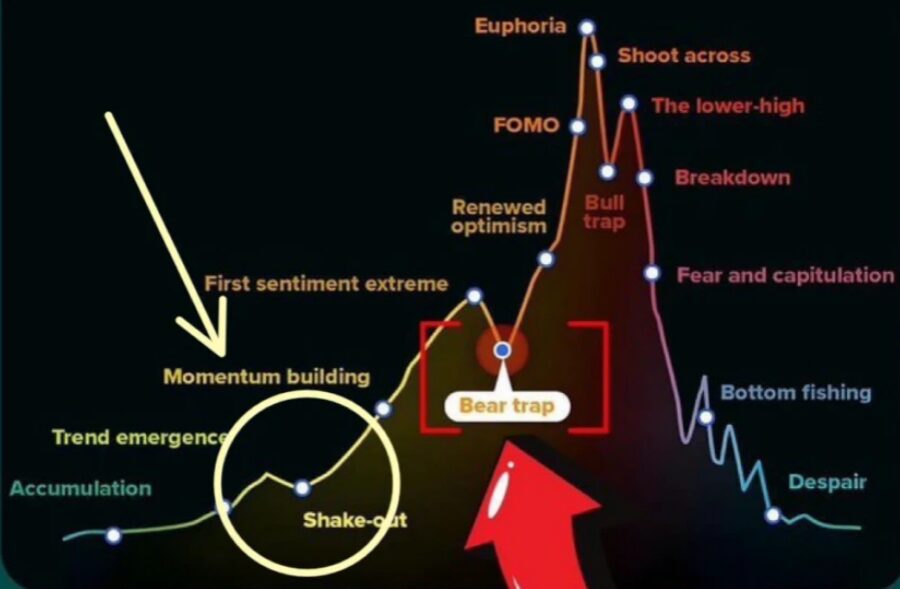
Bitcoin recently broke below the support line of an ascending triangle pattern—a structure typically associated with bullish continuation. However, the inability of bearish traders to sustain downward momentum suggests that the breakdown may have been a classic “bear trap.”
Following the breakdown, buyers stepped in aggressively, pushing the price back above the former support level. This reclaim is significant. If Bitcoin can successfully break above its moving averages, it opens the path toward the $74,508 to $76,000 resistance zone.
From a structural perspective, this is a critical battleground. A confirmed breakout could trigger renewed institutional inflows, particularly as spot ETF dynamics continue to shape liquidity flows into Bitcoin.
However, the bearish scenario remains intact if sellers defend the moving averages. A swift rejection could push Bitcoin below $65,000, exposing the next support zone between $62,500 and $60,000.
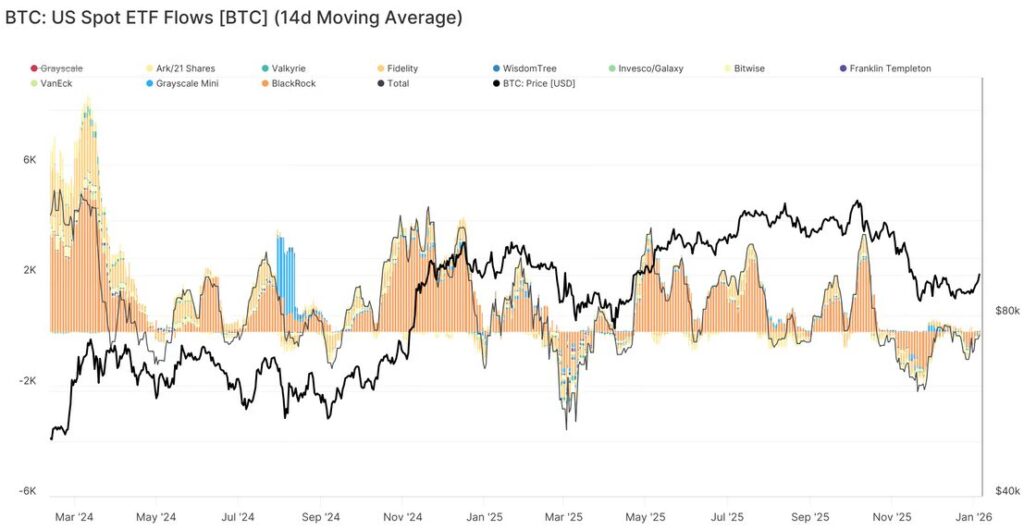
Broader Context: Institutional Influence
Recent trends suggest that Bitcoin is increasingly behaving like a macro asset. Institutional investors, including hedge funds and asset managers, are using Bitcoin as both a hedge and a speculative vehicle. ETF inflows, derivatives positioning, and macro indicators such as interest rates and dollar strength are now tightly correlated with Bitcoin’s price action.
For traders, this means that technical patterns alone are no longer sufficient—macro awareness is essential.
Ethereum: Recovery Attempt Amid Structural Pressure
ETH Moving Average Reclaim Scenario
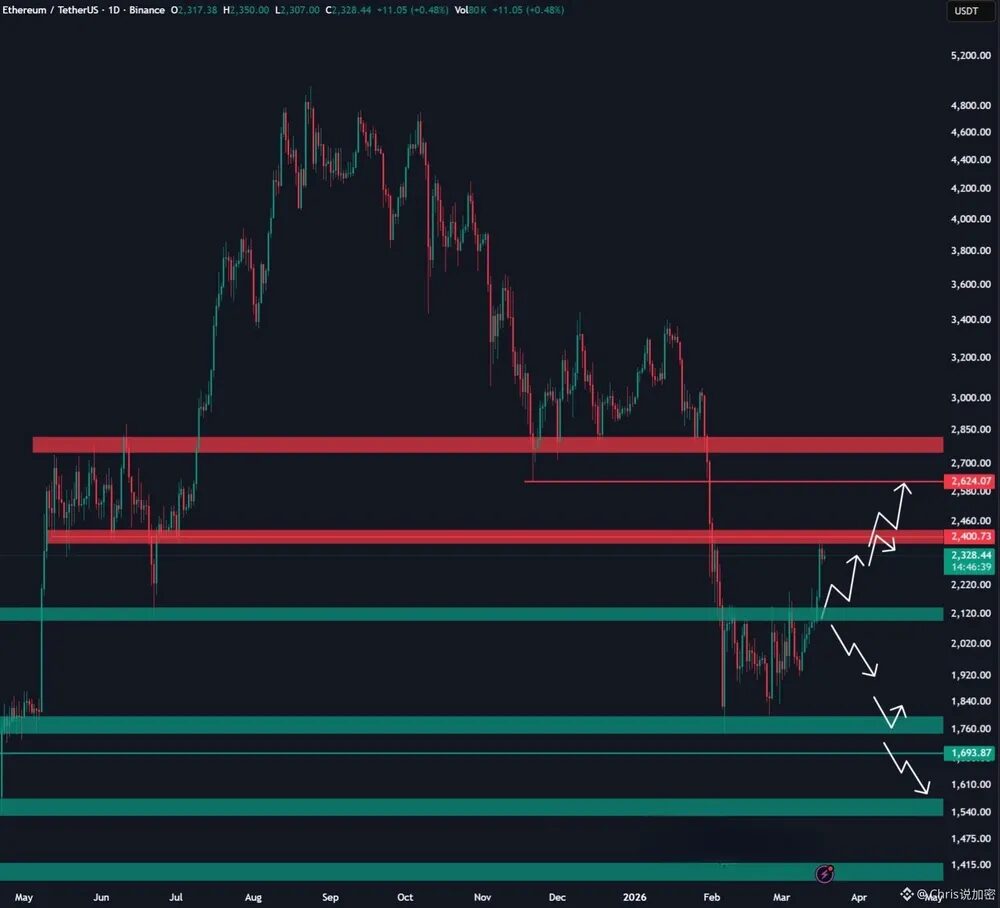
Ethereum recently fell below its 50-day simple moving average around $2,040, signaling short-term weakness. However, bearish momentum failed to push the price below the critical $1,916 support level.
This failure to break support is noteworthy. It suggests that buyers are still active and willing to defend key levels.
If Ethereum manages to reclaim its moving averages, the probability of a rally toward $2,400 increases significantly. A successful breakout above this level could accelerate momentum toward $2,600.
On the downside, a break below $1,916 would invalidate the bullish scenario and open the path toward $1,750.
Structural Drivers: ETH Beyond Price
Ethereum’s long-term narrative remains intact, driven by:
- Layer-2 scaling adoption
- Institutional staking products
- Tokenization of real-world assets
These factors position Ethereum not just as a cryptocurrency, but as a foundational infrastructure layer for decentralized finance and enterprise blockchain applications.
XRP: Persistent Weakness Under Selling Pressure
XRP Downtrend & RSI Weakness
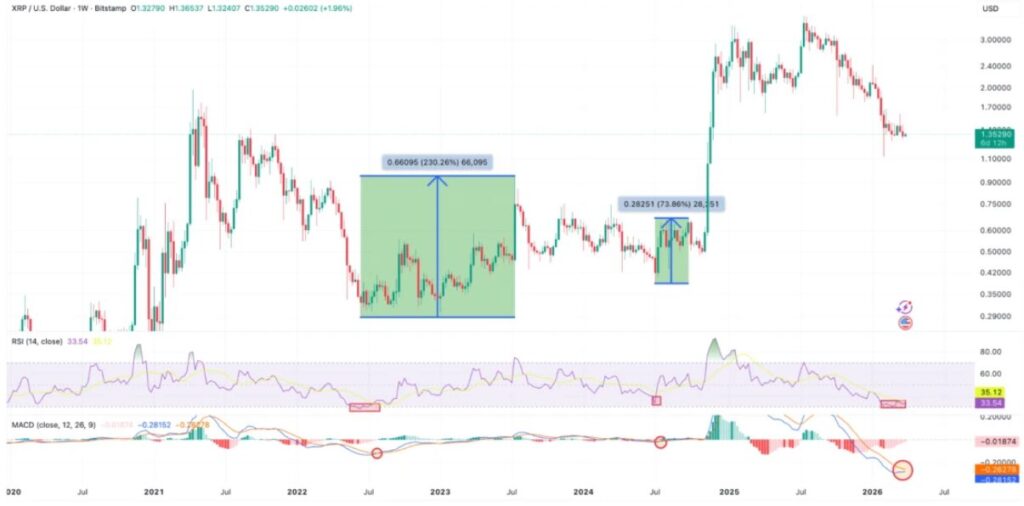
XRP continues to trade below its moving averages, indicating sustained selling pressure. The downward-sloping averages and negative RSI reinforce the bearish outlook.
The $1.27 level is a critical support zone. A breakdown below this level could lead to a decline toward $1.11.
However, XRP is known for sharp reversals. If buyers manage to push the price above the moving averages, it would signal exhaustion of selling pressure. In that case, XRP could rally toward $1.61.
Regulatory and Utility Context
Unlike many cryptocurrencies, XRP’s price is heavily influenced by regulatory developments and institutional partnerships. Its role in cross-border payments and liquidity provisioning gives it a unique positioning, particularly in emerging markets.
For investors, XRP represents a hybrid play between legal clarity and real-world adoption.
Solana: Range-Bound Equilibrium and Breakout Potential
SOL Range Consolidation ($76–$95)
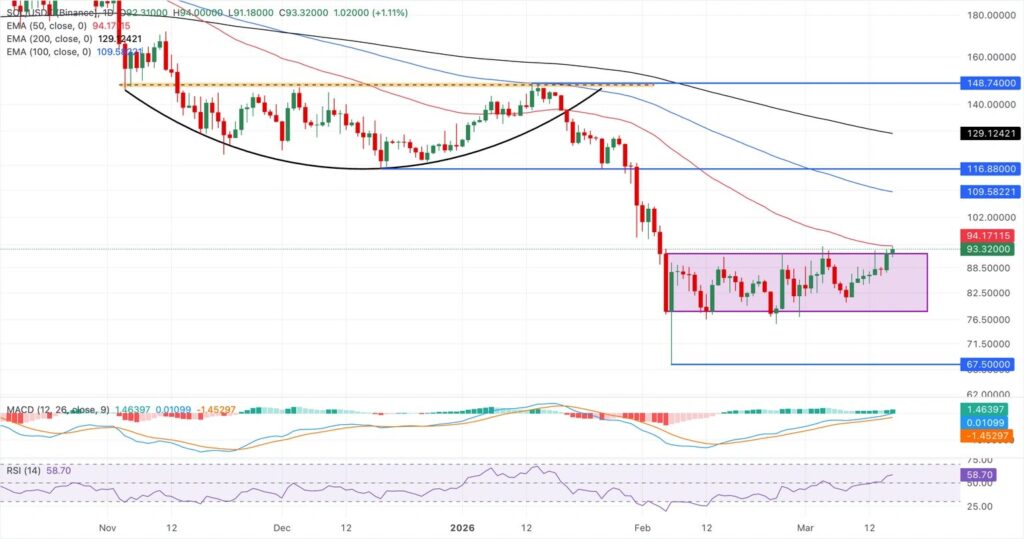
Solana is currently trading within a defined range between $76 and $95, reflecting a balance between supply and demand.
The flat moving averages and neutral RSI indicate that neither bulls nor bears have a clear advantage.
A breakout above $95 could initiate a rally toward $117, signaling renewed bullish momentum.
Conversely, a breakdown below $76 would favor bearish traders and could lead to a retest of the $67 level.
Ecosystem Momentum
Despite price consolidation, Solana’s ecosystem continues to grow, particularly in:
- DeFi applications
- NFT infrastructure
- High-performance trading systems
Its low fees and high throughput make it attractive for developers building scalable blockchain applications.
Macro Trends Shaping the Crypto Market
Crypto Market Macro Drivers (Rates, Liquidity, BTC Correlation)
Beyond individual assets, the broader crypto market is influenced by several key macro trends:
1. Liquidity Conditions
Global liquidity tightening continues to suppress speculative assets, including cryptocurrencies.
2. Interest Rates
Higher interest rates reduce risk appetite, making capital more expensive and less available for speculative investments.
3. Institutional Flows
ETF inflows and institutional positioning are increasingly dictating market direction, particularly for Bitcoin and Ethereum.
4. Market Structure Evolution
Crypto markets are transitioning from retail-driven cycles to institutionally influenced dynamics, resulting in more complex price behavior.
Opportunities for Investors and Builders
For readers seeking new crypto assets, revenue opportunities, or practical blockchain applications, the current environment presents both risks and opportunities:
- Volatility-driven trading strategies remain viable
- Accumulation during consolidation phases can offer long-term upside
- Infrastructure plays (ETH, SOL) may outperform speculative tokens
- Regulatory clarity assets (XRP) offer asymmetric opportunities
Importantly, the convergence of traditional finance and blockchain is creating new hybrid opportunities—particularly in payments, tokenization, and decentralized financial services.
Conclusion: A Market at an Inflection Point
The cryptocurrency market is at a critical juncture. Bitcoin’s potential bear trap, Ethereum’s recovery attempt, XRP’s persistent weakness, and Solana’s consolidation all point to a market searching for direction.
While short-term uncertainty remains high, the long-term trajectory of blockchain adoption continues to strengthen. Institutional participation, technological innovation, and real-world use cases are steadily reshaping the landscape.
For investors and builders alike, the key is not just to follow price—but to understand the underlying structural shifts driving the market.
Those who can navigate both the technical and macro dimensions will be best positioned to capitalize on the next phase of growth.
