
Key Takeaways :
- Bitcoin’s decline to around $60,000 marks its largest post-halving correction, raising the question of whether the current bear market has reached a critical inflection point.
- On-chain data and derivatives metrics suggest widespread deleveraging and weakening speculative activity, typical of mid-cycle bear phases.
- While some analysts argue that $60,000 represents a local bottom aligned with long-term technical support, historical cycles imply the possibility of further downside toward $40,000–$50,000.
- For long-term investors and blockchain practitioners, this phase may represent a transition from speculative excess to strategic accumulation and real-world utility development.
Introduction: A Sharp Correction That Demands Context
Bitcoin’s sudden drop to nearly $60,000 has reignited a familiar debate in the cryptocurrency market: are we witnessing the bottom of the current bear market, or merely passing through its midpoint? According to recent analysis by Kaiko Research, the early-month correction may represent a crucial turning point within the ongoing bearish cycle rather than a definitive bottom.
Data from TradingView shows that Bitcoin (BTC) fell to approximately $59,930 on Friday, marking its lowest level since October 2024, just before Donald Trump’s re-election as U.S. president. This move followed months of post-halving optimism and parabolic price appreciation, suggesting that the market has now entered a cooling phase more consistent with historical post-halving behavior.
The Post-Halving Reality: From Euphoria to Deleveraging
Historically, Bitcoin’s four-year halving cycle has followed a relatively consistent pattern: a sharp rally driven by supply shock and speculative enthusiasm, followed by a prolonged correction and accumulation phase. Kaiko notes that the recent 32% decline from Bitcoin’s local high represents the steepest correction since the 2024 halving event.
Bitcoin Four-Year Halving Cycle and Bear Market Phases

Description: A stylized cycle diagram showing halving events, bull market peaks, subsequent corrections, and accumulation phases
Kaiko’s research emphasizes that multiple on-chain indicators are now flashing signals typically associated with bear market environments. Aggregate spot trading volume across the top ten centralized exchanges fell by approximately 30%, dropping from nearly $1 trillion in October 2025 to around $700 billion in November. This contraction reflects declining retail participation and reduced short-term speculative activity.
Futures Markets Signal Broad Deleveraging
The derivatives market tells a similar story. Combined open interest in Bitcoin and Ethereum futures declined from roughly $29 billion to $25 billion within a single week, a drop of about 14%. Kaiko interprets this as clear evidence of ongoing deleveraging, as traders reduce leverage in response to increased volatility and uncertain macro conditions.
BTC and ETH Futures Open Interest Decline
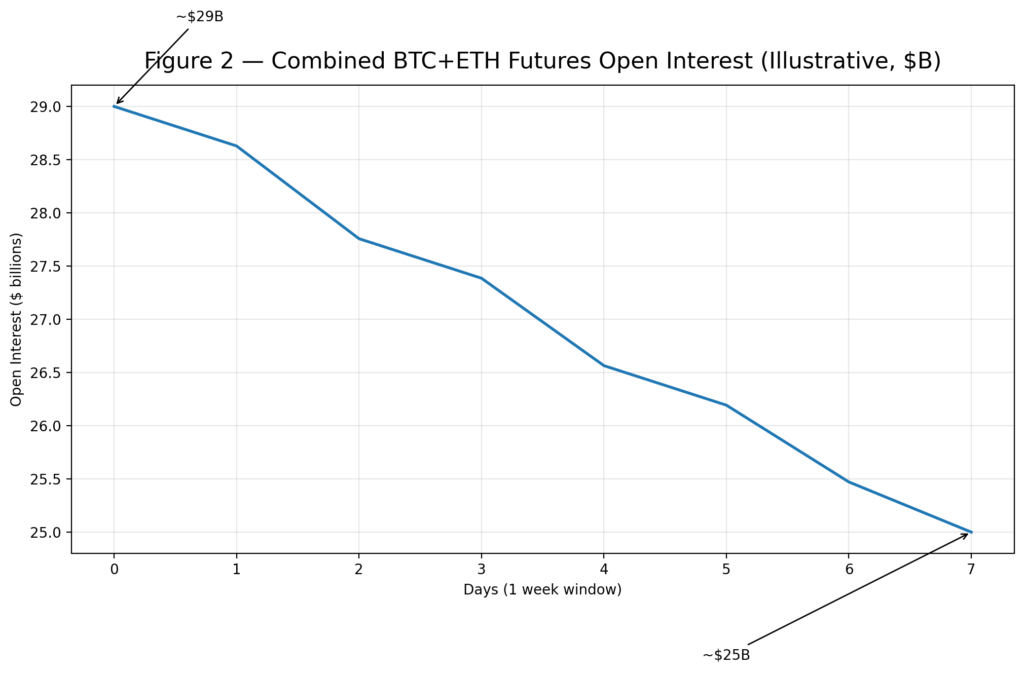
Description: A line graph illustrating the recent reduction in combined futures open interest for Bitcoin and Ethereum.
From a market-structure perspective, such deleveraging events are not inherently bearish in the long term. Instead, they often serve to reset excess risk-taking and lay the groundwork for healthier price discovery.
Diverging Views: Structural Strength vs. Cyclical Weakness
Despite the bearish signals, not all analysts believe that Bitcoin’s long-term trajectory has fundamentally changed. Sean Young, chief analyst at MEXC Research, argues that many of the forces that drove Bitcoin toward its previous high near $126,000 remain intact. These include institutional adoption, expanding ETF accessibility, and Bitcoin’s growing role as a macro hedge.
Young points out that oversold indicators are now visible across multiple timeframes, suggesting that a rebound is less a question of “if” than “when.” He also notes that the market may already be transitioning into the early stages of the next accumulation cycle, which historically precedes renewed bullish momentum.
Is $60,000 the Bottom? Technical and Psychological Perspectives
For investors, the central question remains whether the drop to $60,000 represents the ultimate low of this bear market. Technically, this level aligns closely with Bitcoin’s 200-week moving average, a long-term indicator that has historically functioned as a strong support zone during previous downturns.
However, macro uncertainty and the absence of strong crypto-specific catalysts leave the market vulnerable to further volatility. According to Nicolai Sondergaard, a research analyst at Nansen, it is far from certain that Bitcoin will neatly revert to its traditional four-year cycle pattern.
He notes that while many market participants expect a textbook recovery, an equally large group remains skeptical, particularly given evolving market structures and increasing institutional influence.
Historical Context: Are Deeper Drawdowns Still Possible?
Kaiko further highlights that Bitcoin’s current drawdown of approximately 52% from its all-time high is relatively shallow compared with previous bear markets. Historically, cycle bottoms have typically involved declines of 60% to 68%, which would imply potential downside targets in the $40,000 to $50,000 range.
Historical Bitcoin Drawdowns from All-Time Highs
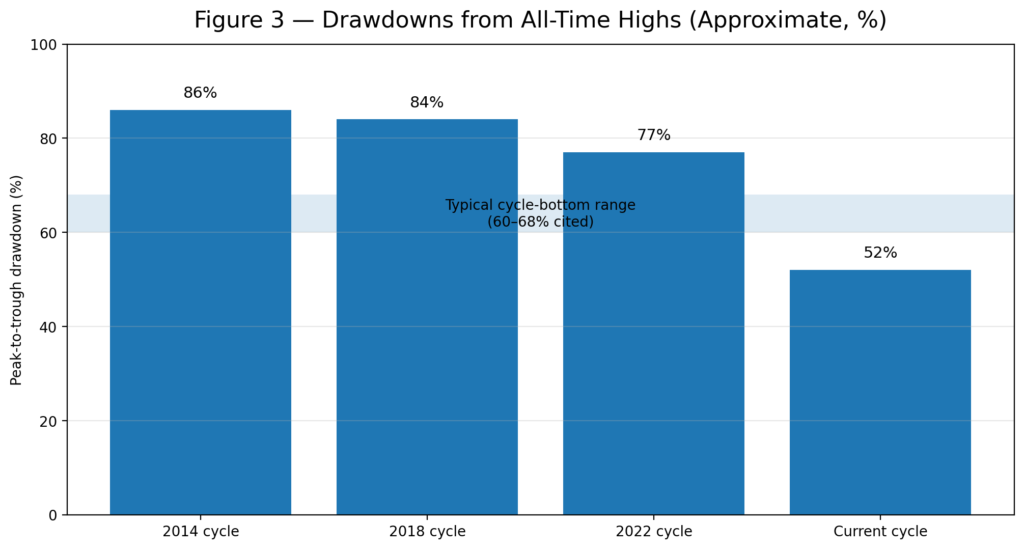
Description: A comparative bar chart showing percentage declines in past Bitcoin bear markets versus the current cycle.
This perspective suggests that while $60,000 may serve as a temporary floor, it may not represent the final bottom if historical patterns continue to exert influence.
Sentiment Indicators and the Case for a Local Bottom
Countering the bearish historical argument, some analysts believe that the recent sell-off already marked a local bottom. Michaël van de Poppe, founder of MN Capital, points to extreme pessimism in investor sentiment and a sharp decline in the Relative Strength Index (RSI) to levels last seen during the 2018 and 2020 market lows.
Such conditions often coincide with exhaustion selling, where market participants capitulate en masse, setting the stage for at least a medium-term recovery. From this viewpoint, the $60,000 level may already represent a psychologically and technically significant inflection point.
Implications for Investors and Blockchain Builders
For readers seeking new crypto assets, alternative revenue streams, or practical blockchain applications, the current environment demands a shift in mindset. Bear market midpoints are rarely characterized by excitement or narrative-driven speculation. Instead, they favor disciplined capital allocation, infrastructure development, and experimentation with real-world use cases.
Historically, many of the most successful blockchain projects and investment strategies have emerged during periods of market pessimism, when attention shifts away from price and toward fundamentals.
Conclusion: A Market at a Crossroads
Bitcoin’s drop to $60,000 may indeed represent a critical midpoint in the current bear market rather than its conclusion. On-chain data, futures market deleveraging, and declining spot volumes all suggest that the market is undergoing a necessary reset following post-halving exuberance.
At the same time, long-term structural drivers remain intact, and sentiment indicators hint that downside risk may be increasingly limited. Whether Bitcoin ultimately revisits lower levels around $40,000–$50,000 or begins a gradual recovery from $60,000, this phase is likely to define the next cycle’s winners.
For investors and builders alike, the key takeaway is not to predict the exact bottom, but to recognize that periods like this often offer the most asymmetric opportunities for those willing to think beyond short-term price action.
