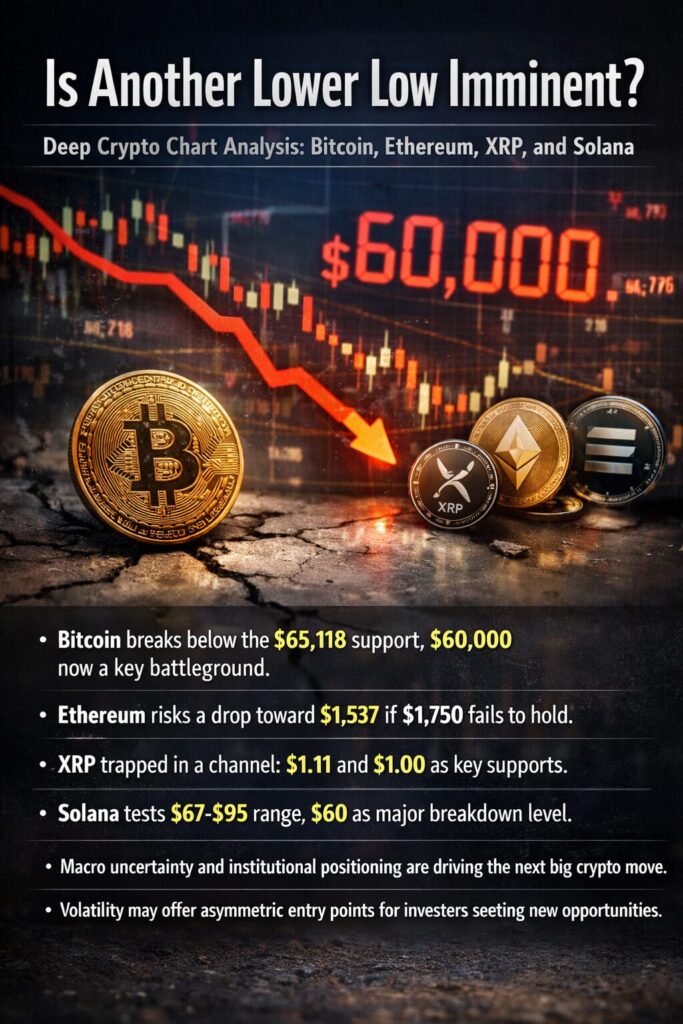
Main Points :
- Bitcoin has broken below the critical $65,118 support, with $60,000 now becoming a decisive battlefield.
- Ethereum risks accelerating toward $1,537 if $1,750 fails to hold.
- XRP remains trapped in a descending channel, with $1.11 and $1.00 as major psychological supports.
- Solana faces a structural test between $67 and $95, with $60 as a potential breakdown level.
- Broader macro uncertainty and institutional positioning are shaping the next major crypto move.
- For investors seeking new yield opportunities, volatility may create asymmetric entry points.
Market Context: A Fragile Equilibrium
The cryptocurrency market is once again at a critical inflection point. After months of volatile consolidation, Bitcoin has slipped below the $65,118 support level, raising concerns that the broader market could be preparing for another leg down.
However, markets rarely move in straight lines. What we are witnessing is a tension between short-term bearish momentum and longer-term structural accumulation. Institutional flows remain present, derivatives positioning is cautious, and liquidity conditions are tightening globally.
For investors seeking new crypto assets, yield strategies, or practical blockchain adoption opportunities, understanding this technical landscape is essential.
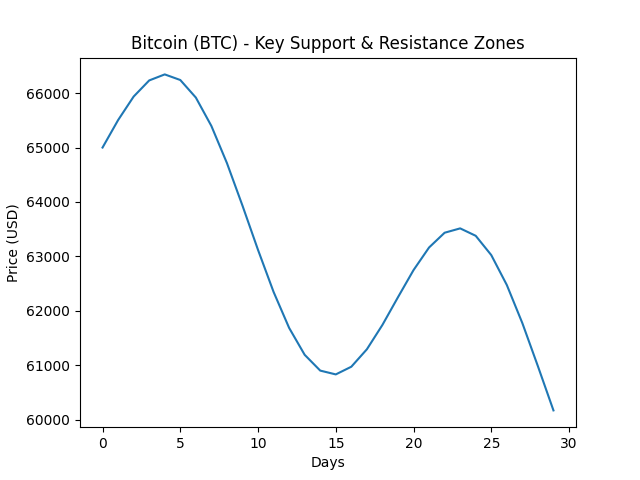
Bitcoin (BTC) Technical Outlook
Support Breakdown and the $60,000 Battlefield
Bitcoin recently broke below the $65,118 support level. Although bulls are attempting to reclaim this level on a closing basis, the damage to short-term structure is evident.
The 20-day Exponential Moving Average (EMA) currently sits near $70,185. Any relief rally toward this zone is likely to encounter significant selling pressure.
If Bitcoin sharply rejects at the 20-day EMA, the probability of a decline toward the psychologically critical $60,000 support increases substantially. A decisive break below $60,000 could open the door toward $52,500.
This $60,000 region is not merely technical — it represents a macro sentiment threshold. Below it, fear intensifies. Above it, confidence stabilizes.
What Bulls Must Do
To demonstrate genuine strength, buyers must push price back above the 20-day EMA and maintain acceptance above it. If successful, Bitcoin could attempt a move toward $74,508, where strong resistance is expected.
Failure to reclaim momentum, however, suggests further downside before any sustainable rally.
[Bitcoin Chart]
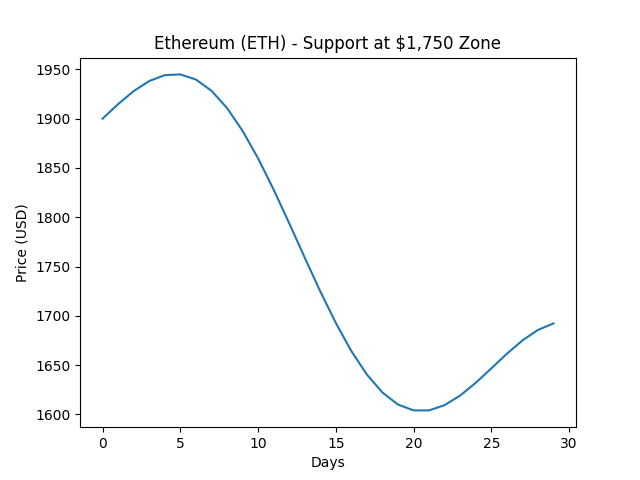
Ethereum (ETH) Technical Outlook
$1,750: The Line in the Sand
Ethereum has fallen below its recent $1,897 support and is now approaching the critical $1,750 level.
The moving averages are trending downward, and the Relative Strength Index (RSI) is approaching oversold territory — a sign of persistent bearish pressure.
If Ethereum closes below $1,750, the next major support lies near $1,537. A break there would confirm renewed bearish momentum.
However, if ETH rebounds sharply from $1,750, this would indicate strong demand absorption at lower levels. In that scenario, ETH may consolidate within a range between $1,750 and $2,111.
A daily close above $2,111 would signal potential recovery strength and open the path toward the 50-day Simple Moving Average near $2,593.
Structural Perspective
Ethereum’s long-term fundamentals remain intact — especially given ongoing development in Layer 2 scaling, real-world asset tokenization, and staking participation. However, in the short term, price action remains technically fragile.
[Ethereum Chart]
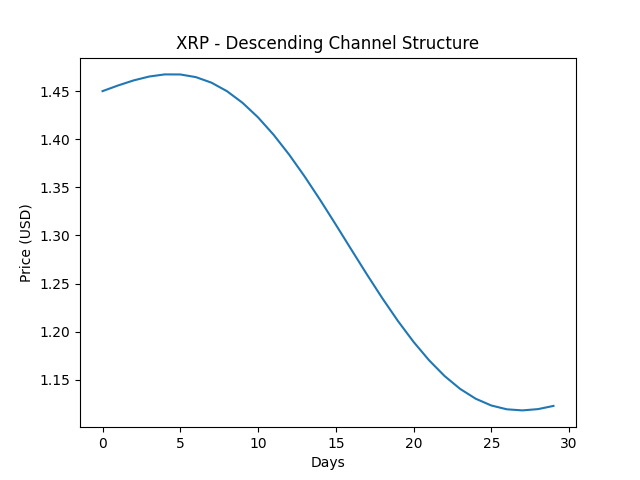
XRP Technical Outlook
Descending Channel Pressure
XRP has been trading between the descending channel support and its 20-day EMA near $1.47.
The downward-sloping EMA and negative RSI reading suggest sellers maintain control.
If XRP breaks below the channel support, it could revisit the February low near $1.11. A close below $1.11 increases the probability of a decline toward the psychological $1.00 level.
For bulls to shift momentum, price must quickly reclaim the descending trendline and hold above it.
Broader Considerations
XRP remains uniquely positioned due to regulatory clarity developments and its cross-border settlement utility. However, in pure technical terms, structure favors bears unless a decisive breakout occurs.
[ XRP Chart]
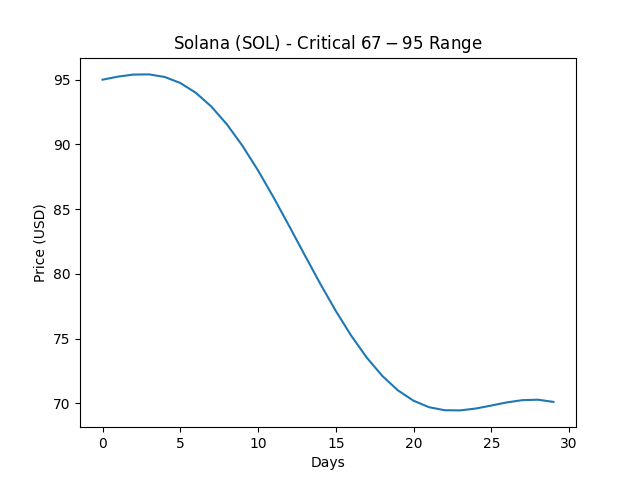
Solana (SOL) Technical Outlook
Critical Range: $67 to $95
Solana’s inability to reclaim $95 signals active selling at higher levels.
Sellers are attempting to push price below $76. If successful, SOL could decline toward the key February low near $67.
A breakdown below $67 exposes the market to a rapid drop toward $60.
On the upside, both the 20-day EMA and $95 act as resistance. A daily close above $95 would weaken bearish dominance and potentially trigger a sharp rally toward $117.
Ecosystem Strength vs Price Weakness
Despite price pressure, Solana continues to show strength in developer activity, DeFi volume, and consumer-facing applications. This divergence between price and ecosystem growth is noteworthy for long-term investors.
[Solana Chart]
Macro Forces Influencing the Market
Beyond individual charts, several macro elements are influencing crypto volatility:
- Global liquidity tightening
- U.S. interest rate expectations
- Institutional ETF flows
- Risk-off sentiment across equities
Institutional participation has not disappeared, but leverage has reduced. Retail participation remains muted compared to previous cycles.
This creates a market environment prone to sharp liquidation cascades — both upward and downward.
Strategic Implications for Investors
For readers seeking new crypto opportunities or yield generation:
- Volatility creates asymmetric entry opportunities.
- Structural support zones often define high-reward risk points.
- Capital preservation during breakdown phases is critical.
- Monitoring reclaim levels (20-day EMA zones) provides early reversal signals.
Rather than predicting direction, sophisticated participants prepare for both scenarios.
Conclusion: Breakdown or Reset Before Expansion?
The crypto market currently stands at a structural crossroads.
Bitcoin’s defense of $60,000 will likely determine broader sentiment. Ethereum’s battle at $1,750, XRP’s channel support, and Solana’s $67 floor are equally decisive.
Another lower low is possible — but so is a volatility-driven reset before expansion.
For long-term blockchain believers and capital allocators, the current phase may represent preparation rather than collapse.
Markets test conviction before rewarding patience.
The next move will not simply determine short-term price — it will define the psychological structure of the next cycle.
