
Main Points :
- Bitcoin is consolidating between strong support at $84,000 and a major resistance zone near $94,600, suggesting a decisive breakout is approaching.
- Ethereum’s symmetrical triangle reflects market indecision, but a breakout could trigger a strong trend toward $4,386.
- XRP remains under bearish pressure within a descending channel, yet a break above key moving averages may signal a trend reversal.
- Solana shows early signs of weakening selling pressure, with momentum hinging on reclaiming the 20-day EMA.
- Meme and legacy altcoins such as Dogecoin, Cardano, and Bitcoin Cash highlight selective risk appetite returning to the market.
- For investors seeking new crypto assets and revenue opportunities, the coming weeks may define medium-term portfolio strategies.
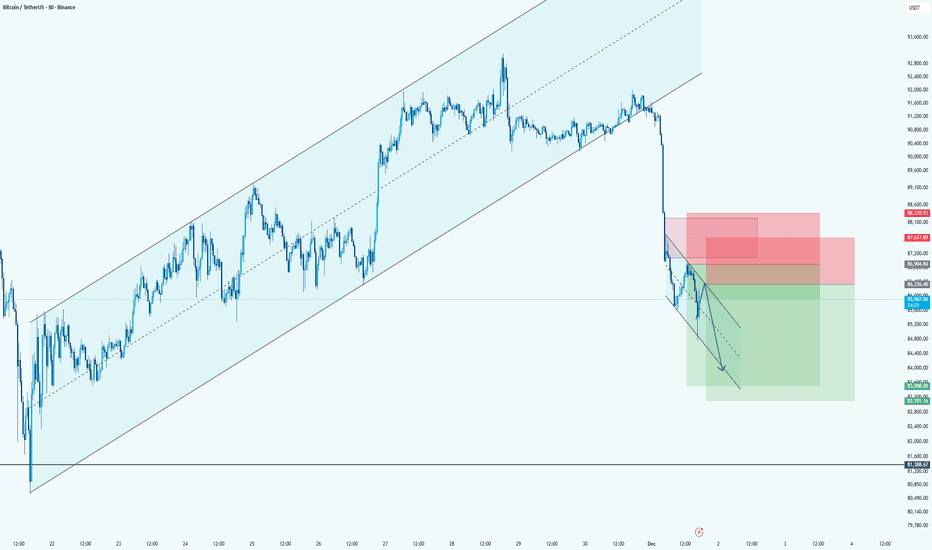
1. Bitcoin (BTC) Price Outlook: Bulls Defend Structure but Face Heavy Resistance
Bitcoin rebounded strongly from the $84,000 support zone, reaffirming its importance as a psychological and technical floor. However, the recovery has stalled near the 20-day exponential moving average (EMA) around $89,300, indicating that sellers remain active at higher levels. Despite this, the fact that bulls have not allowed a sharp retracement suggests underlying demand remains firm.
If Bitcoin manages to close decisively above the 20-day EMA, attention will quickly shift to the 50-day simple moving average (SMA) near $92,800. This level has historically acted as a medium-term trend filter, and a break above it would likely attract momentum-driven buyers. Beyond that, the critical resistance at $94,600 stands out as the final barrier before confirming the end of the current corrective phase.
A daily close above $94,600 would be technically significant. Such a move would indicate that sellers have lost control, opening the path toward the psychologically important $100,000 level, followed by a potential extension toward $107,500. This scenario would reinforce Bitcoin’s role as the anchor asset of the crypto market, often leading capital inflows into altcoins.
On the downside, failure to hold $84,000 on a closing basis would suggest that bearish forces have regained dominance. In that case, deeper corrections could unfold, especially if macroeconomic sentiment or liquidity conditions deteriorate.
[Bitcoin daily chart showing 20-day EMA, 50-day SMA, and key support/resistance levels]
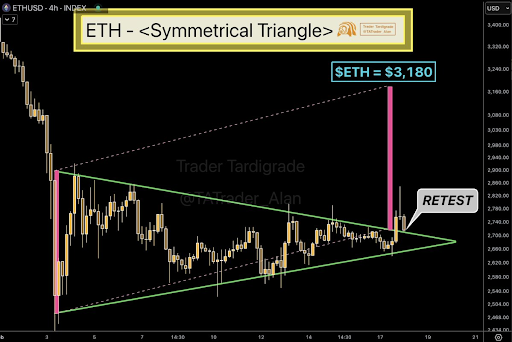
2. Ethereum (ETH) Price Outlook: Symmetrical Triangle Signals a Powerful Move Ahead
Ethereum is currently trading within a symmetrical triangle pattern, a classic technical formation that reflects balance between buyers and sellers. Such patterns often precede sharp directional moves, making ETH one of the most strategically important assets to watch.
If buyers succeed in pushing ETH above its moving averages, price could advance toward the upper resistance line of the triangle. A confirmed breakout would invalidate bearish expectations and could trigger a rapid rally toward $4,000, followed by the pattern’s projected target near $4,386. This would likely coincide with renewed interest in Ethereum-based applications, DeFi protocols, and layer-2 ecosystems.
Conversely, a rejection from the moving averages followed by a breakdown below the triangle’s support line would favor bears. In such a scenario, ETH could decline sharply toward $2,111, a level that would test long-term investor conviction.
Ethereum’s position as the backbone of smart contract infrastructure means its price action has implications beyond speculation. For readers interested in practical blockchain use cases, ETH’s next move may determine development momentum and capital allocation across the ecosystem.
[Ethereum daily chart highlighting the symmetrical triangle and breakout levels]
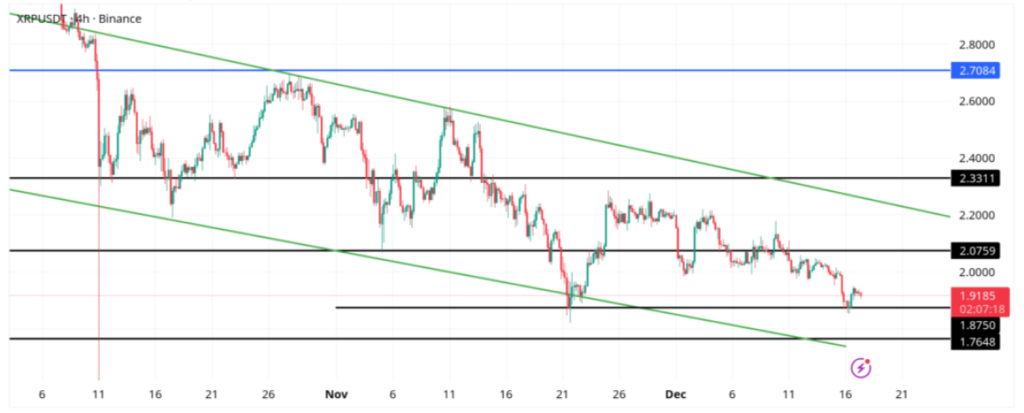
3. XRP Price Outlook: Descending Channel Keeps Bears in Control—for Now
XRP has rebounded from the support line of a descending channel but continues to face stiff resistance near the 20-day EMA at approximately $1.98. This price behavior reflects a cautious market, with traders unwilling to commit aggressively in either direction.
Should XRP fail to break above the 20-day EMA and instead reverse lower, bears will likely attempt to push the price toward the $1.61 support level. A breakdown below this area could accelerate selling pressure, potentially dragging XRP down to $1.25, a level last seen in early October.
However, the bearish outlook would be challenged if XRP manages to climb above its moving averages. A sustained move beyond the descending trendline would suggest a potential trend reversal, encouraging sidelined buyers to re-enter the market.
For investors seeking asymmetric opportunities, XRP represents a higher-risk, higher-reward scenario where regulatory clarity and broader market sentiment could quickly alter technical structures.
[XRP daily chart with descending channel and key EMA resistance]
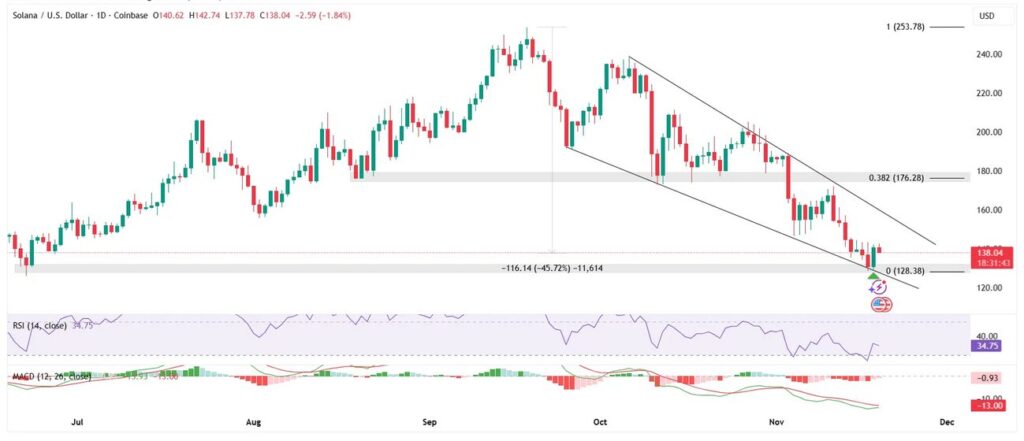
4. Solana (SOL) Price Outlook: Momentum Shift Depends on EMA Reclaim
Solana remains below its major moving averages, indicating that the broader trend is still under bearish influence. However, a positive divergence on the relative strength index (RSI) suggests that selling pressure is gradually weakening.
If SOL breaks above the 20-day EMA near $130, the pair could rally toward overhead resistance at $147. A daily close above $147 would confirm that bulls are regaining control, potentially opening the door for a move toward $172. Such a recovery would reignite interest in Solana’s high-throughput blockchain and its expanding ecosystem of applications.
On the downside, a sharp rejection from the 20-day EMA would reinforce negative sentiment. In that case, SOL could slide toward $110 and eventually test the strong support zone near $95.
Solana’s performance is particularly relevant for readers focused on practical blockchain scalability and user-facing applications, as network adoption often correlates with sustained price trends.
[Solana daily chart showing RSI divergence and EMA levels]
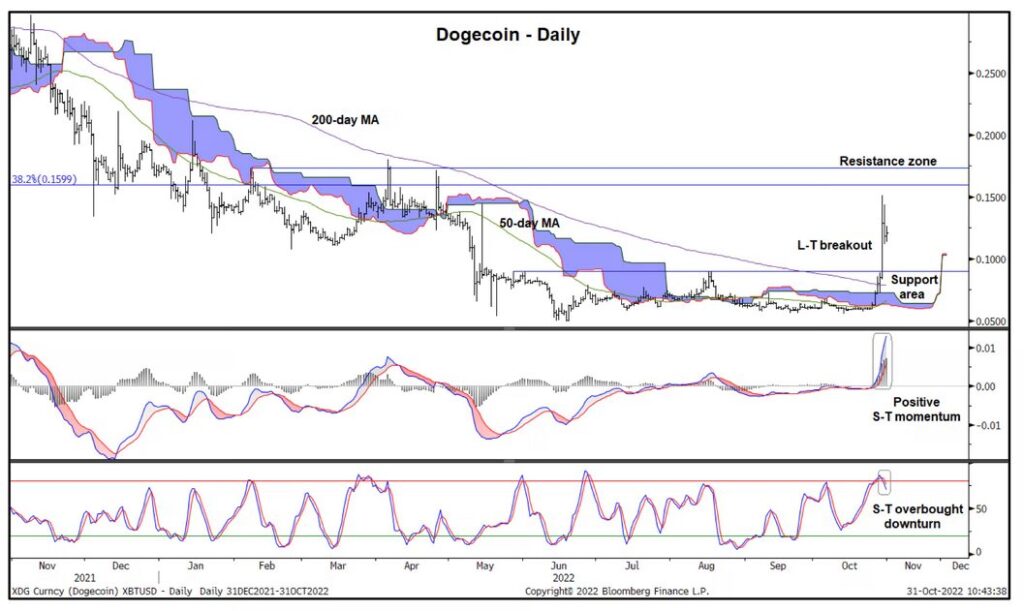
5. Dogecoin (DOGE) Price Outlook: Speculative Interest Returns at Key Levels
Dogecoin has reclaimed the $0.13 level, indicating that buyers are stepping in at lower prices. However, sellers are expected to defend the moving averages aggressively. If DOGE turns lower from these averages and breaks below $0.12, bearish control would remain intact, potentially pushing the price toward $0.10.
For a more constructive outlook, bulls must propel DOGE above the 50-day SMA near $0.15. Sustained trading above $0.16 would bring the broader range between $0.13 and $0.27 back into focus, suggesting renewed speculative appetite.
[Dogecoin daily chart with range boundaries and moving averages]
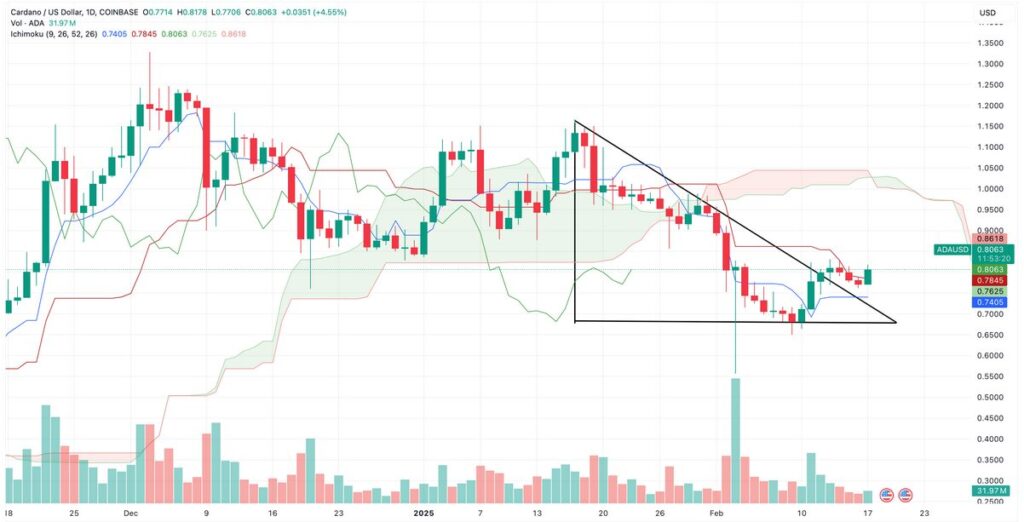
6. Cardano (ADA) Price Outlook: Divergence Offers Hope Amid Resistance
Cardano’s recovery has stalled near $0.37, now acting as resistance. If the price turns lower and breaks below $0.34, bears may extend the decline toward $0.27.
A constructive sign for bulls is the positive RSI divergence, hinting at weakening downside momentum. A breakout above the 20-day EMA around $0.40 could trigger a rally toward $0.50, a major overhead resistance.
[Cardano daily chart highlighting RSI divergence and resistance zones]
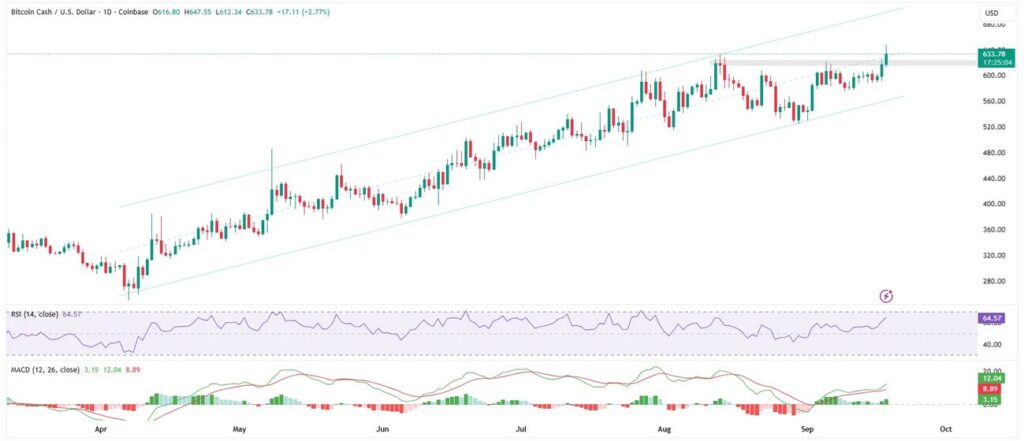
7. Bitcoin Cash (BCH) Price Outlook: Buyers Defend EMA After Failed Breakout
Bitcoin Cash briefly pierced resistance at $615 but failed to sustain the breakout. Bears pulled the price back toward the 20-day EMA near $571, where buyers stepped in aggressively.
If the rebound continues, bulls may attempt another push toward $651 and $720. Conversely, a break below the 20-day EMA would suggest profit-taking, potentially dragging BCH toward the 50-day SMA near $538.
[Bitcoin Cash daily chart showing EMA support and resistance targets]
Conclusion: A Market at a Defining Moment
The current crypto market landscape reflects a delicate balance between caution and opportunity. Bitcoin’s consolidation near critical resistance, Ethereum’s tightening triangle, and mixed signals across major altcoins suggest that a decisive move is imminent. For investors seeking new crypto assets, revenue opportunities, and practical blockchain applications, disciplined observation and risk management are essential.
A confirmed breakout in Bitcoin and Ethereum would likely usher in renewed confidence, while failure at key levels could prolong consolidation. Either way, the coming weeks are poised to shape the medium-term trajectory of the digital asset market.
