
Main Points :
- Bitcoin breaks out of a symmetrical triangle, signaling renewed bullish momentum with $74,508 as the next key resistance and $84,000 as a possible upside target.
- Ethereum attempts to reclaim $2,111 resistance; a breakout could open the path toward the $2,381 50-day moving average.
- XRP stabilizes around the $1.42 20-day EMA, suggesting sustained bullish pressure while traders watch for a break above the downtrend line.
- Solana consolidates between $76 and $95, showing accumulation at lower levels and potential for a rally toward $117.
- Broader crypto market trends—including institutional adoption, ETF inflows, and growing real-world blockchain applications—are strengthening the long-term outlook for digital assets.
1. A Market Regaining Momentum
The cryptocurrency market is showing renewed signs of strength after a period of consolidation and volatility. Bitcoin, Ethereum, XRP, and Solana—four of the most closely watched digital assets—are all demonstrating technical patterns that suggest a possible continuation of the current recovery phase.
While the crypto market remains sensitive to macroeconomic developments such as interest rates, regulatory decisions, and liquidity conditions, recent chart patterns indicate that bullish sentiment is gradually returning. Technical indicators, including moving averages and momentum oscillators, reveal a shift in market dynamics as buyers increasingly step in at key support levels.
For investors searching for the next revenue opportunity or emerging blockchain use case, understanding these technical signals is crucial. Market cycles often begin with subtle changes in price structure before transitioning into larger macro trends. In that sense, the current recovery phase could represent an early stage of a broader market expansion.
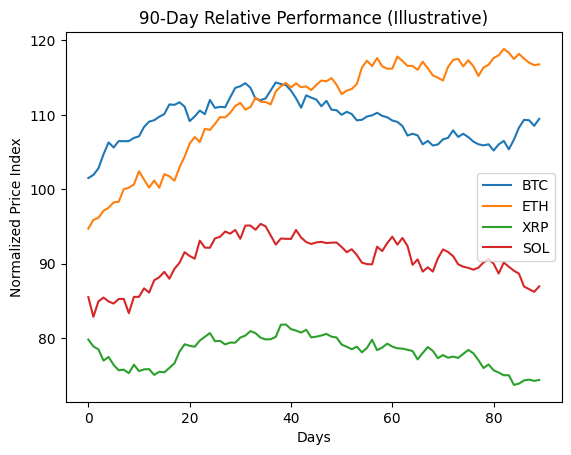
A comparison chart showing BTC, ETH, XRP, and SOL performance over the past 90 days.
2. Bitcoin: Symmetrical Triangle Breakout Signals Strength
Bitcoin continues to act as the anchor of the cryptocurrency market. Recently, its price broke above the resistance line of a symmetrical triangle pattern, a technical formation often associated with continuation trends.
This breakout indicates that buyers are gaining control after weeks of compression between narrowing support and resistance lines. When such patterns resolve to the upside, they often trigger momentum buying as traders interpret the move as confirmation of bullish strength.
The next significant resistance level for Bitcoin is around $74,508. At this level, sellers are expected to mount strong resistance, potentially triggering short-term profit-taking.
However, if Bitcoin pulls back from this level but finds support near the 20-day exponential moving average (EMA), currently around $68,871, it would suggest that the overall sentiment remains positive. In such a scenario, a new upward leg toward $84,000 becomes increasingly plausible.
On the other hand, if Bitcoin experiences a sharp rejection near $74,508 and closes below the 20-day EMA, the short-term trend could shift back in favor of the bears. Such a move might indicate that the breakout was premature or that broader market liquidity remains fragile.
Beyond the chart itself, Bitcoin’s fundamental outlook is also improving. Institutional adoption continues to grow, particularly through spot Bitcoin ETFs, which have attracted billions of dollars in inflows. These developments are strengthening Bitcoin’s position not only as a speculative asset but also as a digital macro hedge similar to gold.
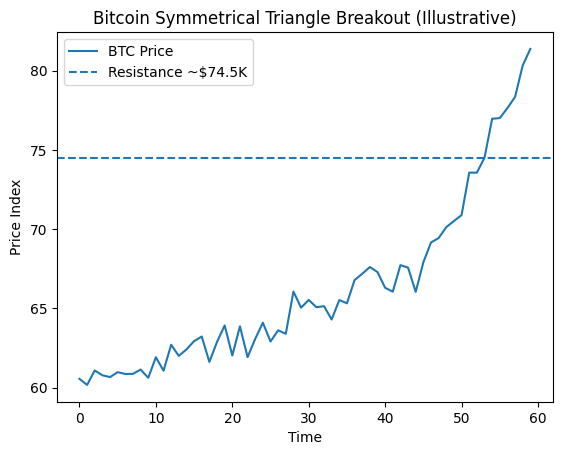
BTC chart highlighting the symmetrical triangle breakout and key resistance levels.
3. Ethereum: Battling the $2,111 Resistance
Ethereum, the second-largest cryptocurrency by market capitalization, is currently attempting to break through a key overhead resistance level around $2,111.
A successful close above this level would confirm strong buying activity and open the path toward the 50-day simple moving average (SMA) near $2,381. Historically, such moving averages often act as dynamic resistance during corrective phases.
If Ethereum manages to push above the 50-day SMA, it could signal the end of the recent correction and mark the beginning of a new upward trend.
However, the bullish scenario is not guaranteed. If Ethereum sharply reverses from $2,111 and drops below $1,907, the asset may remain trapped in a consolidation range between $1,750 and $2,111 for a longer period.
Beyond price charts, Ethereum continues to strengthen its ecosystem through technological upgrades and growing decentralized finance (DeFi) activity. Layer-2 scaling networks, such as Arbitrum and Optimism, are significantly reducing transaction costs and increasing network capacity.
Moreover, institutional investors are paying closer attention to Ethereum due to its role as the backbone of decentralized applications, NFTs, and tokenized assets.
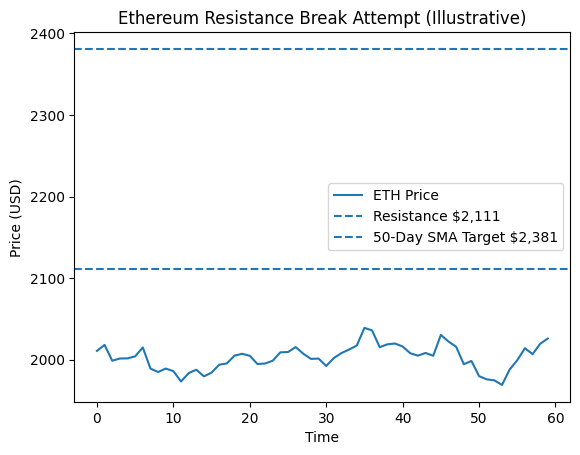
ETH chart showing the $2,111 resistance and the 50-day SMA target.
4. XRP: Consolidation Near the 20-Day EMA
XRP has been trading close to its 20-day EMA around $1.42, suggesting that bullish pressure remains intact.
When a cryptocurrency repeatedly tests a short-term moving average without breaking significantly below it, it often indicates that buyers are absorbing selling pressure.
If XRP closes above the 20-day EMA with strong momentum, the next technical target would be the downtrend line, which has capped price advances for several months.
A decisive break above this downtrend line would signal a potential trend reversal and attract renewed investor interest.
However, if XRP fails to break above the 50-day SMA near $1.60, or if it is rejected at the downtrend line, it may continue trading within its current channel for several more days.
The broader outlook for XRP is heavily influenced by regulatory developments and Ripple’s expanding cross-border payment infrastructure. Many financial institutions continue exploring Ripple’s technology as a faster and cheaper alternative to traditional remittance systems.
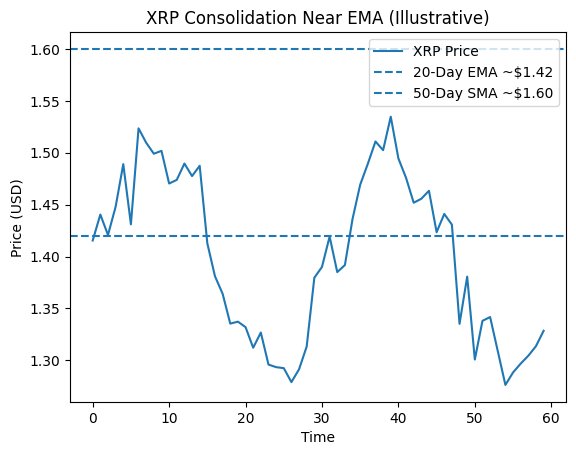
XRP chart highlighting EMA support and the downtrend resistance line.
5. Solana: Accumulation Signals Potential Breakout
Solana has spent several days consolidating between $76 and $95, suggesting that buyers are accumulating the asset at lower levels.
A sideways consolidation following a decline often indicates that selling pressure is fading. In Solana’s case, the 20-day EMA around $86 is flattening, while the relative strength index (RSI) is hovering slightly above the midpoint.
These indicators suggest that the market is approaching a balance between buyers and sellers.
If bulls manage to push the price above $95, the breakout could trigger a strong rally toward approximately $117.
However, sellers may attempt to defend the $95 resistance level aggressively in order to keep the asset trapped within its current range.
Solana’s ecosystem continues to expand rapidly, particularly in decentralized finance, NFT markets, and blockchain gaming. Its high throughput and low transaction fees make it one of the most attractive platforms for scalable blockchain applications.
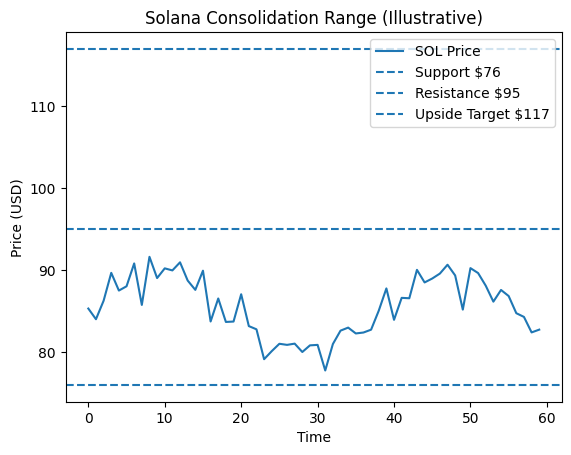
SOL chart highlighting the $76–$95 range and potential breakout target.
6. Broader Crypto Trends Supporting the Recovery
Beyond the charts of individual cryptocurrencies, several macro-level developments are supporting the broader market recovery.
Institutional participation in crypto markets has grown significantly over the past year. Spot Bitcoin ETFs, for example, have introduced a regulated investment vehicle that allows traditional investors to gain exposure to digital assets.
At the same time, major financial institutions are increasingly exploring blockchain technology for practical applications such as cross-border payments, tokenized securities, and decentralized finance infrastructure.
Another important trend is the expansion of stablecoin usage. Stablecoins are becoming a critical bridge between traditional financial systems and decentralized blockchain ecosystems, enabling faster settlement and improved liquidity.
Finally, advancements in blockchain scalability—including layer-2 networks and modular architectures—are making it possible to build real-world applications that were previously impractical due to high transaction costs.
Conclusion: Early Signs of a New Crypto Expansion
The technical patterns emerging in Bitcoin, Ethereum, XRP, and Solana suggest that the cryptocurrency market may be entering a new phase of recovery.
While resistance levels remain ahead and short-term volatility is inevitable, the underlying structure of the market appears to be strengthening. Breakouts from consolidation patterns, rising institutional participation, and continued technological innovation all point toward a potentially bullish medium-term outlook.
For investors searching for the next major opportunity in digital assets, the current environment may represent a critical transition period. Understanding both technical indicators and broader industry trends will be essential for navigating the evolving landscape of blockchain-based finance.
