
Main Points :
- Bitcoin continues to maintain a strong upward trend, supported by moving averages and improving market sentiment.
- Ethereum shows bullish continuation potential following a confirmed golden cross and strong RSI readings.
- XRP is approaching a critical descending trendline that could determine short-term trend reversal.
- Solana demonstrates improving momentum, with buyers increasingly active on pullbacks.
- These four assets collectively represent not only market leadership but also different layers of blockchain utility and revenue opportunities.
1. Market Context: Why This Uptrend Matters
The cryptocurrency market has entered a phase where technical strength and fundamental narratives are aligning. Unlike previous speculative rallies driven primarily by retail enthusiasm, the current upward momentum is supported by a combination of institutional participation, improving macro conditions, and expanding real-world blockchain use cases.
For investors seeking new digital assets, alternative income sources, and practical blockchain applications, this environment offers both opportunity and selectivity. Bitcoin, Ethereum, XRP, and Solana are not merely price-driven instruments; they represent distinct infrastructural layers of the crypto economy—store of value, programmable settlement, cross-border liquidity, and high-performance decentralized applications.
In this article, we analyze recent price action using classical technical indicators while also integrating broader market trends observed across major exchanges and on-chain data providers.
2. Bitcoin (BTC): Price Outlook and Structural Strength
[BTC/USD Daily Chart with 50-day SMA and RSI]
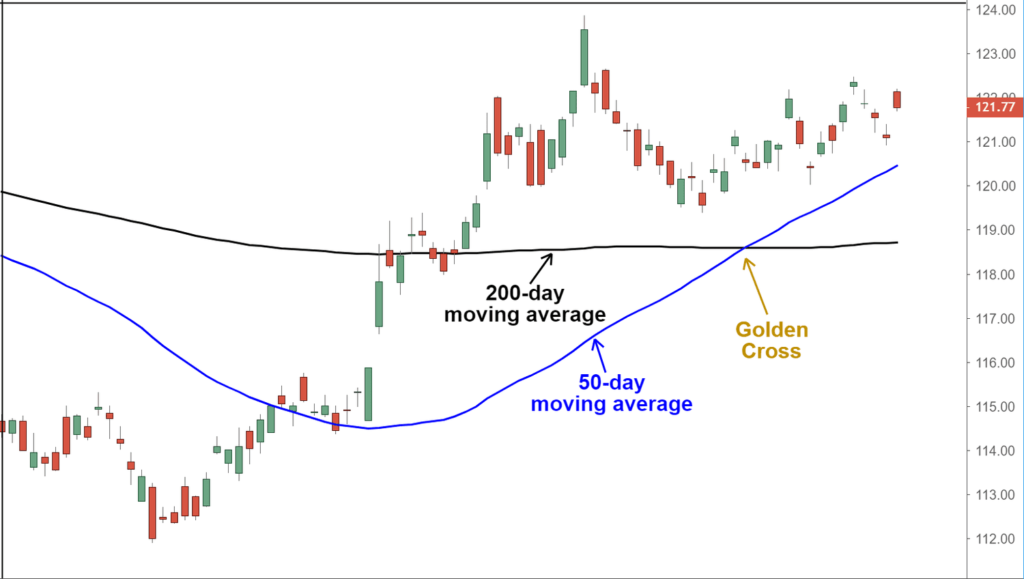
Bitcoin recently closed above its 50-day Simple Moving Average (SMA) at $89,231, a key technical development that signals renewed buyer confidence. Following this breakout, BTC continued to advance toward the $94,589 resistance level, which now acts as the immediate ceiling for further upside.
From a trend perspective, the moving averages are on the verge of forming a golden cross, a bullish signal where the short-term moving average crosses above the long-term average. Simultaneously, the Relative Strength Index (RSI) remains firmly in positive territory, indicating that momentum favors buyers rather than exhaustion-driven speculation.
Should Bitcoin achieve a confirmed breakout above $94,589, the next psychological target would be $100,000, followed by a potential extension toward $107,500. These levels are not arbitrary; they align with historical resistance zones and option market positioning.
However, risk management remains essential. A sharp rejection from resistance followed by a breakdown below moving averages could lead BTC into a consolidation range between $84,000 and $94,589, reflecting temporary equilibrium rather than trend reversal.
3. Ethereum (ETH): Bullish Continuation with Structural Support
[ETH/USD Daily Chart with Symmetrical Triangle Pattern]
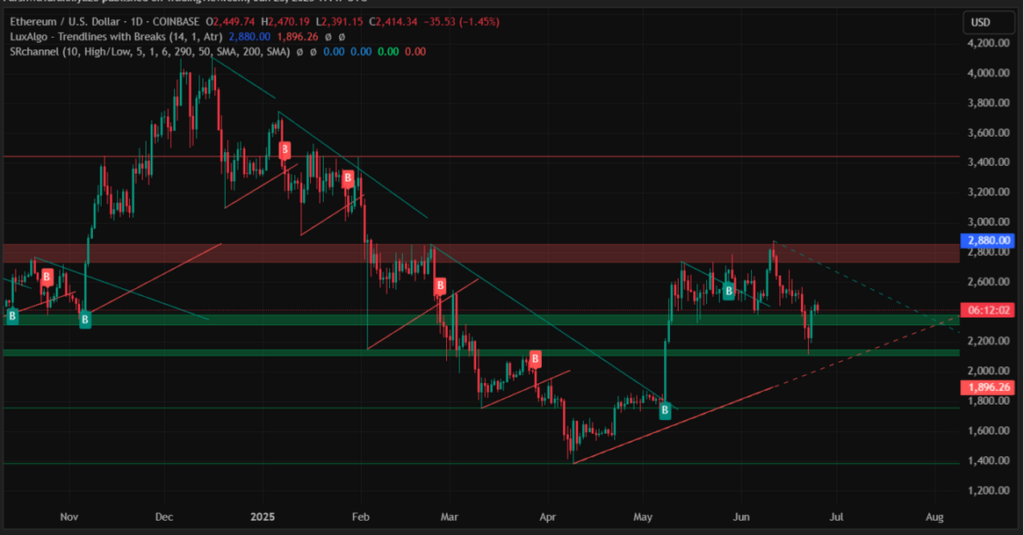
Ethereum is currently testing the upper boundary of a symmetrical triangle, a classic continuation pattern that often resolves in the direction of the prevailing trend. Importantly, ETH has already confirmed a golden cross, reinforcing the medium-term bullish structure.
The RSI has climbed above 63, suggesting strong but not overheated momentum. If Ethereum closes decisively above the triangle resistance, the price could advance toward $3,659, with $4,000 emerging as the next major psychological and technical target.
On the downside, the moving averages and the lower trendline of the triangle are expected to attract buying interest. A breakdown below this support would invalidate the bullish scenario and indicate a potential trend reversal.
Ethereum’s significance extends beyond price. As the dominant smart contract platform, ETH benefits from growth in DeFi, tokenization, and institutional-grade blockchain infrastructure.
4. XRP: Approaching a Make-or-Break Trendline
[XRP/USD Daily Chart with Descending Channel]
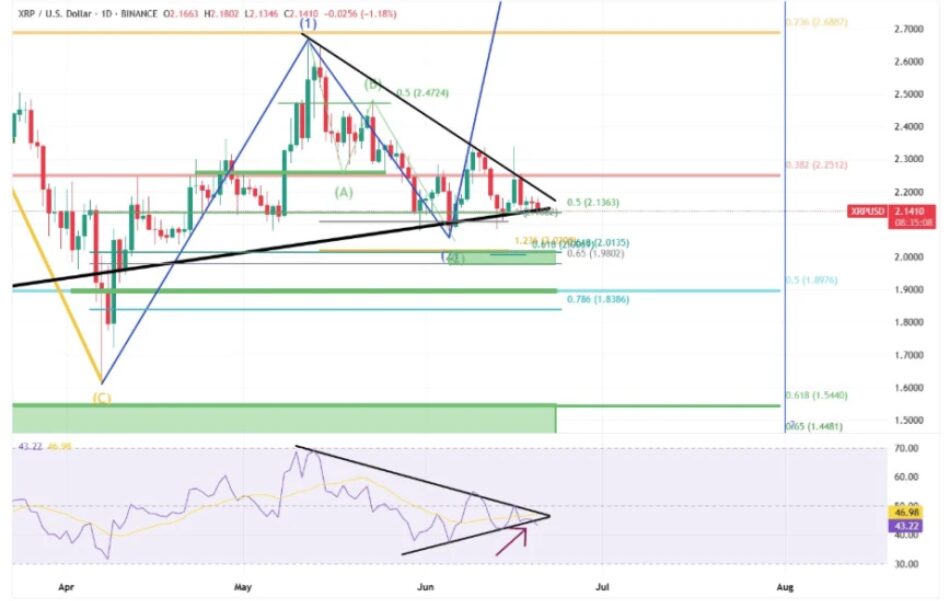
XRP is trading above its moving averages, signaling that bulls have regained short-term control. The price is now approaching the descending trendline of a downward channel, a level that historically acts as strong resistance.
If XRP fails at this trendline and reverses sharply, the asset may remain range-bound within the channel for several days. Conversely, a daily close above the descending trendline would suggest a short-term trend reversal, opening the path toward $3.00.
From a bearish perspective, sellers would need to push XRP below the $1.61 support level to reassert dominance. Until then, the risk-reward balance increasingly favors cautious accumulation.
XRP’s broader relevance lies in cross-border payment infrastructure, where efficiency and regulatory clarity continue to drive long-term adoption discussions.
5. Solana (SOL): Momentum Returns as Buyers Defend Pullbacks
[SOL/USD Daily Chart with 20-day EMA]
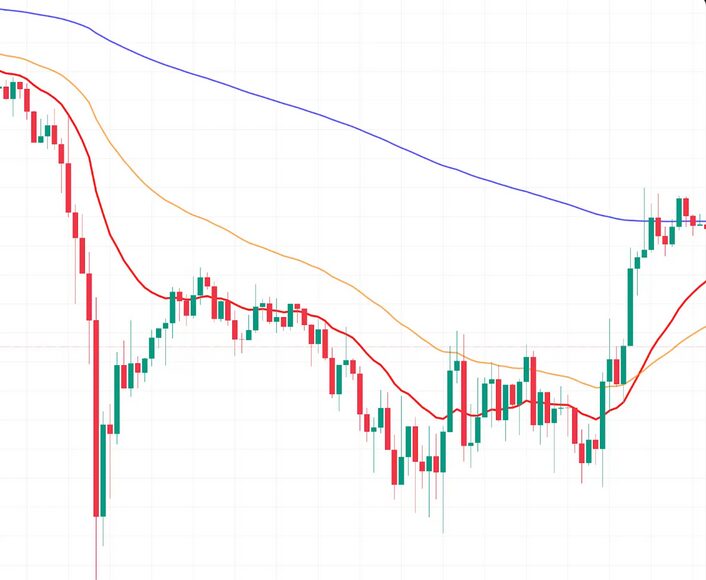
Solana recently closed above its moving averages, signaling weakening bearish pressure. The 20-day Exponential Moving Average (EMA) at $128 has turned upward, while RSI has moved into positive territory.
This setup suggests that buyers are becoming more aggressive on pullbacks. A continued rebound could carry SOL toward $147, a level likely to attract selling pressure initially.
If pullbacks from $147 are shallow and supported by the 20-day EMA, it would indicate improving investor confidence. In such a scenario, a breakout above $147 becomes increasingly likely, with $172 as the next upside target.
Solana’s appeal is closely tied to its high-throughput architecture and growing ecosystem of decentralized applications, particularly in consumer-facing and high-frequency use cases.
6. Strategic Implications for Investors and Builders
Across these four assets, a common theme emerges: technical strength supported by functional relevance. For investors, this environment favors disciplined strategies—combining trend confirmation with risk controls—rather than indiscriminate speculation.
For builders and operators, the sustained uptrend reinforces the viability of blockchain-based business models, from payments and settlement to decentralized finance and tokenized assets.
7. Conclusion
The cryptocurrency market continues to maintain an upward bias, with Bitcoin, Ethereum, XRP, and Solana each exhibiting constructive technical structures. While short-term volatility remains inevitable, the broader trend suggests that capital is rotating into assets with both liquidity and real-world utility.
For those seeking new crypto assets, diversified income opportunities, and practical blockchain applications, understanding these technical and structural dynamics is no longer optional—it is essential.
