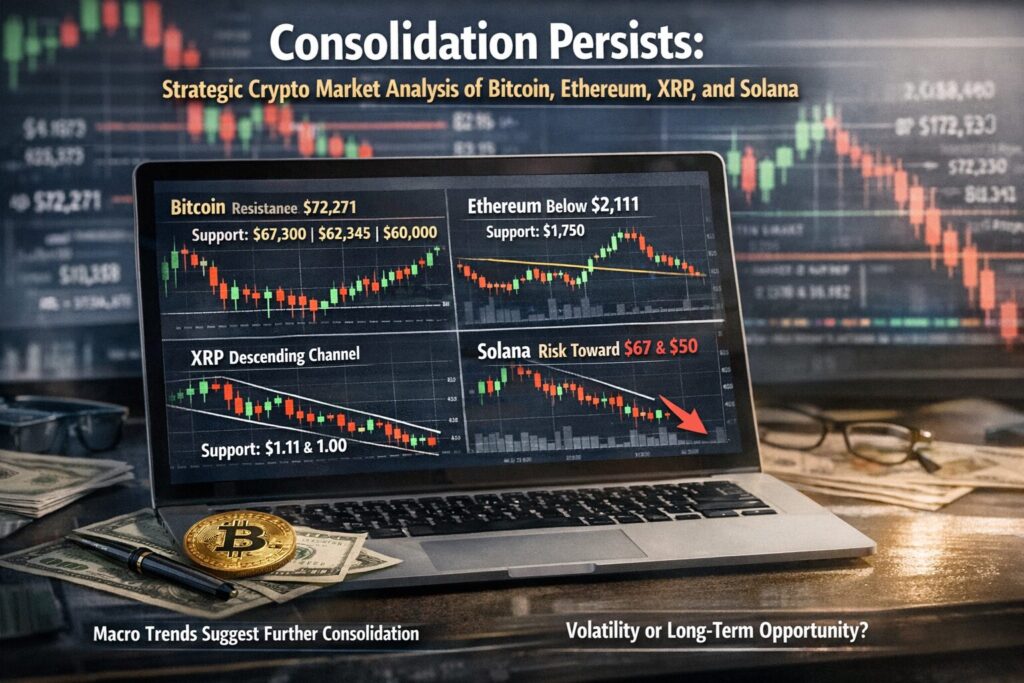
Main Points :
- Bitcoin faces persistent selling pressure near $72,271, with key support at $67,300, $62,345, and $60,000.
- Ethereum struggles below $2,111; $1,750 is the critical defensive level.
- XRP remains inside a descending channel, with $1.11 and $1.00 as decisive support levels.
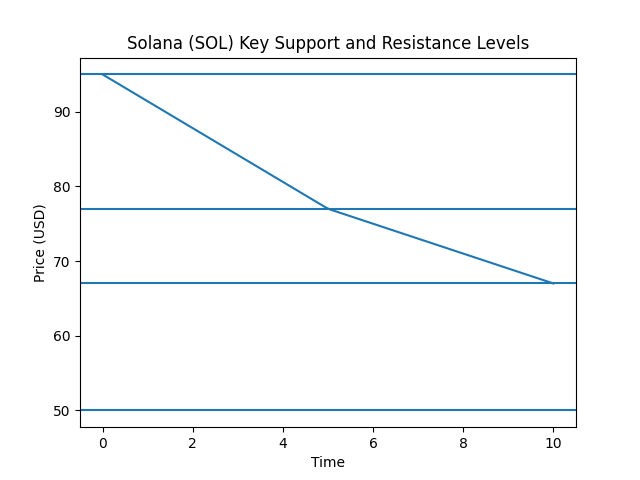
- Solana’s failed recovery below $95 increases downside risk toward $67 and potentially $50.
- Broader macro and institutional trends suggest consolidation may precede a structural move rather than a collapse.
- Investors seeking new revenue streams must distinguish between short-term volatility and long-term adoption signals.
Market Context: Why Consolidation Matters
The cryptocurrency market is currently in a prolonged consolidation phase. Bitcoin, Ethereum, XRP, and Solana — four of the most closely watched digital assets — are all trading within technically defined ranges, reflecting uncertainty rather than directional conviction.
For readers searching for new crypto opportunities, yield strategies, or practical blockchain applications, consolidation periods are not idle phases. Historically, they represent accumulation zones, liquidity resets, and volatility compression before significant directional moves.
Institutional flows into Bitcoin ETFs, stablecoin settlement expansion, Layer-2 adoption, and real-world asset tokenization continue progressing in the background. Yet price action remains restrained. This divergence between fundamental adoption and short-term chart hesitation is precisely where strategic investors focus.
Let us examine each asset in depth.
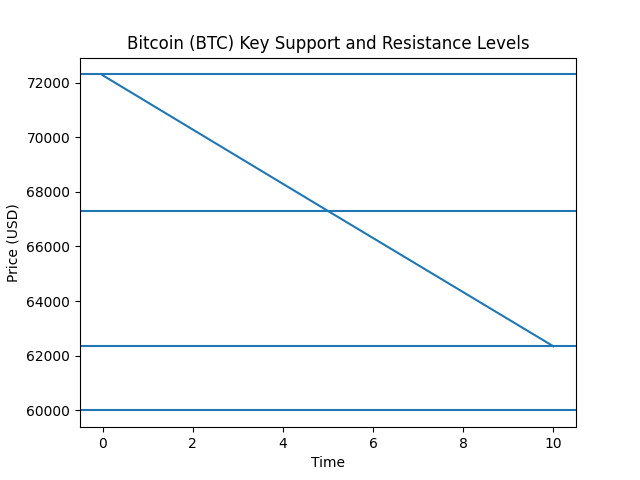
Bitcoin (BTC): Defending the Macro Structure
Key Levels
- Resistance: $72,271
- 20-day EMA: $76,275
- 50-day SMA: $85,832
- Support: $67,300
- Major support: $62,345
- Psychological support: $60,000
- Breakdown risk: $52,500
Bitcoin recently rejected from $72,271, signaling persistent selling pressure at higher levels. The failure to sustain upward momentum suggests short-term traders are taking profits while long-term holders remain relatively inactive.
If BTC remains below $67,300, downside risk expands toward $62,345 and then $60,000. The $60,000 level is particularly important. It is both psychologically significant and technically defended in prior cycles. A confirmed daily close below $60,000 could expose the market to $52,500.
Conversely, a recovery above $72,271 would shift sentiment. Sustained movement above the 20-day EMA at $76,275 would indicate that buyers are regaining control. A break toward the 50-day SMA at $85,832 would strongly suggest that a short-term bottom has formed.
Beyond technicals, institutional ETF inflows remain a structural support mechanism. Corporate treasury allocation discussions are expanding globally, and Bitcoin’s positioning as a digital reserve asset remains intact. Consolidation, therefore, may reflect capital rotation rather than structural weakness.
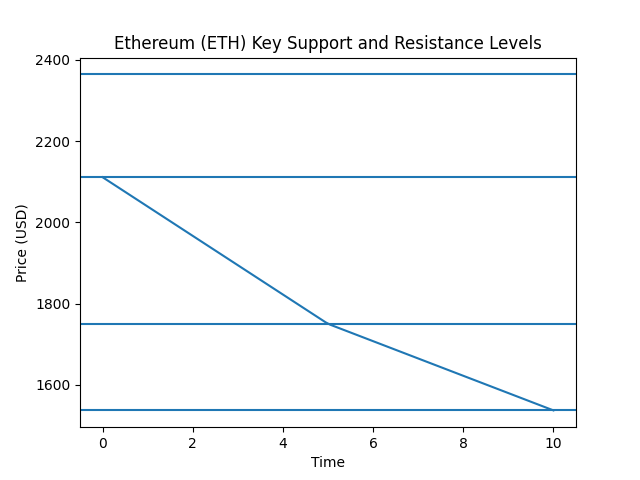
Ethereum (ETH): Compression Before Expansion?
Key Levels
- Resistance: $2,111
- 20-day EMA: $2,364
- 50-day SMA: $2,838
- Support: $1,750
- Breakdown target: $1,537
Ethereum rejected from $2,111, demonstrating that bearish participants are defending that level aggressively. The next critical zone is $1,750 — a historically strong demand area.
If ETH rebounds firmly from $1,750, we may see range-bound behavior rather than collapse. This would suggest volatility compression ahead of a directional breakout.
However, a breakdown below $1,750 opens risk toward $1,537. That zone would represent significant technical damage.
The first bullish signal would be a move back above $2,111. A push above the 20-day EMA at $2,364 would improve structure. Sustained recovery toward the 50-day SMA at $2,838 would suggest renewed trend momentum.
Fundamentally, Ethereum continues to benefit from Layer-2 rollup adoption, staking participation, and tokenized real-world asset experimentation. Institutions are exploring tokenized bonds, settlement systems, and on-chain finance infrastructure. Therefore, price consolidation may coexist with ecosystem expansion.
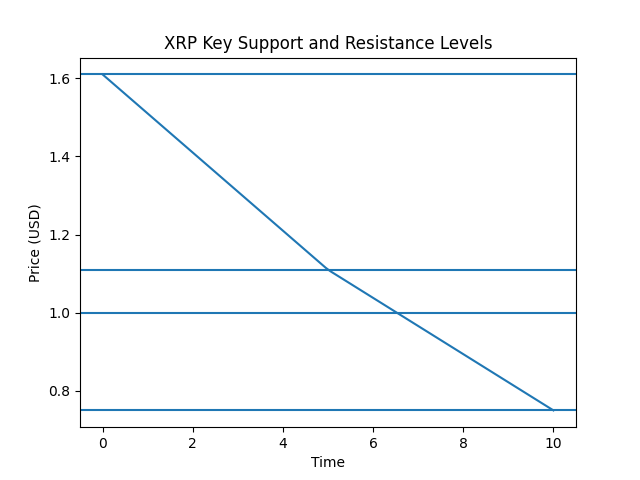
XRP: Pressure Inside a Descending Channel
Key Levels
- Channel resistance: $1.61
- 50-day SMA: $1.85
- Support: $1.11
- Psychological support: $1.00
- Extreme support: $0.75
XRP remains inside a descending channel pattern. Buyers have managed to keep the price above the lower support line, but strong rebounds have not materialized.
This weak bounce increases the probability of a breakdown. If XRP falls below support, $1.11 becomes the immediate retest zone. A breakdown under $1.11 exposes $1.00, and further weakness could accelerate toward $0.75.
For sentiment to shift, buyers must push XRP above $1.61. A breakout toward the 50-day SMA at $1.85 would indicate improving structure and possibly a reversal attempt.
From a macro perspective, XRP’s relevance depends heavily on cross-border settlement integration and regulatory clarity. As financial institutions continue exploring blockchain-based liquidity rails, XRP remains positioned as a candidate infrastructure asset — but adoption timing remains uncertain.
Solana (SOL): Breakdown Retest Dynamics
Key Levels
- Breakdown level turned resistance: $95
- 20-day EMA: $100
- 50-day SMA: $121
- Minor support: $77
- Major support: $67
- Breakdown extension: $50
Solana’s rebound stalled below $95 — a former support now acting as resistance. This is a classic breakdown-retest scenario.
There is minor support near $77. A breakdown below this level increases risk toward $67. If $67 fails, downside momentum could extend to $50.
The first sign of strength would be a daily close above the 20-day EMA at $100. That would invalidate the bearish breakdown. A move toward the 50-day SMA at $121 would suggest recovery momentum.
Solana remains one of the most active smart contract ecosystems in terms of transaction throughput and developer engagement. Decentralized physical infrastructure (DePIN), NFT marketplaces, and payment experiments continue to expand on Solana. Thus, price weakness does not necessarily imply ecosystem stagnation.
Broader Trends: Why This Consolidation Is Different
Several structural trends distinguish this consolidation from previous cycles:
- Institutional capital now participates structurally via ETFs.
- Stablecoin usage is expanding in cross-border commerce.
- Tokenized real-world assets are entering pilot stages.
- Regulatory clarity is improving in multiple jurisdictions.
- Developer ecosystems are more mature.
Unlike prior speculative-driven cycles, this environment blends macro finance with blockchain infrastructure growth. Volatility compression during such transitions often precedes structural repricing.
For investors seeking new revenue sources, the key question is not whether volatility exists — it always does — but whether adoption metrics support long-term value creation.
Strategic Interpretation for Opportunity Seekers
Short-term traders focus on support and resistance levels. Long-term capital allocators focus on structural adoption.
Bitcoin’s consolidation above $60,000 maintains macro strength.
Ethereum’s compression near $1,750 may represent accumulation.
XRP’s descending channel reflects uncertainty but not irrelevance.
Solana’s breakdown retest may provide asymmetric opportunity if ecosystem growth persists.
In yield-seeking environments, staking, liquidity provision, and tokenized asset exposure may offer alternative revenue streams beyond price speculation.
Conclusion
The cryptocurrency market remains in a consolidation phase across Bitcoin, Ethereum, XRP, and Solana. Technical structures show vulnerability but not structural collapse.
Key support levels will determine whether this range resolves upward or downward. However, broader institutional adoption, infrastructure development, and real-world blockchain integration suggest that this consolidation may be transitional rather than terminal.
For readers searching for the next digital asset opportunity or blockchain-based revenue source, patience and structural analysis are more valuable than reactive trading.
Consolidation is not inactivity. It is preparation.
