Main Points :
- Renewed trade war tensions are suppressing risk appetite across global markets, including crypto assets.
- Bitcoin is testing its 20-day EMA near $92,625, a critical short-term support level.
- Ethereum remains trapped in a symmetrical triangle, signaling indecision rather than trend confirmation.
- XRP shows renewed bearish pressure after slipping below its 50-day SMA around $2.
- Solana is consolidating in a wide range, reflecting both strong long-term interest and short-term caution.
1. Macro Backdrop: Trade War Anxiety and Its Impact on Crypto
The re-emergence of trade war concerns has pushed global markets into a cautious, wait-and-see mode. While cryptocurrencies are often described as “macro-hedged” or independent from traditional finance, recent cycles have shown that they are still highly sensitive to global liquidity conditions, interest-rate expectations, and geopolitical risk.
In the current environment, traders are reducing leverage and focusing more on key technical levels rather than aggressive trend-following strategies. This behavior is clearly visible across major crypto charts, where prices are hovering near moving averages or consolidating within well-defined ranges.
For long-term builders and investors, this phase is not merely about short-term price direction. It is also a reminder that crypto markets are increasingly integrated into the global financial system. Understanding macro signals—such as trade conflicts, monetary tightening, and capital flows—has become essential for identifying sustainable opportunities in digital assets.
2. Bitcoin Price Outlook: Holding the Line at the 20-Day EMA
Bitcoin’s recent pullback has reached its 20-day exponential moving average (EMA) at approximately $92,625, a level widely regarded as a short-term trend indicator.
【Bitcoin : Daily chart (20-day EMA, major resistance/support)】
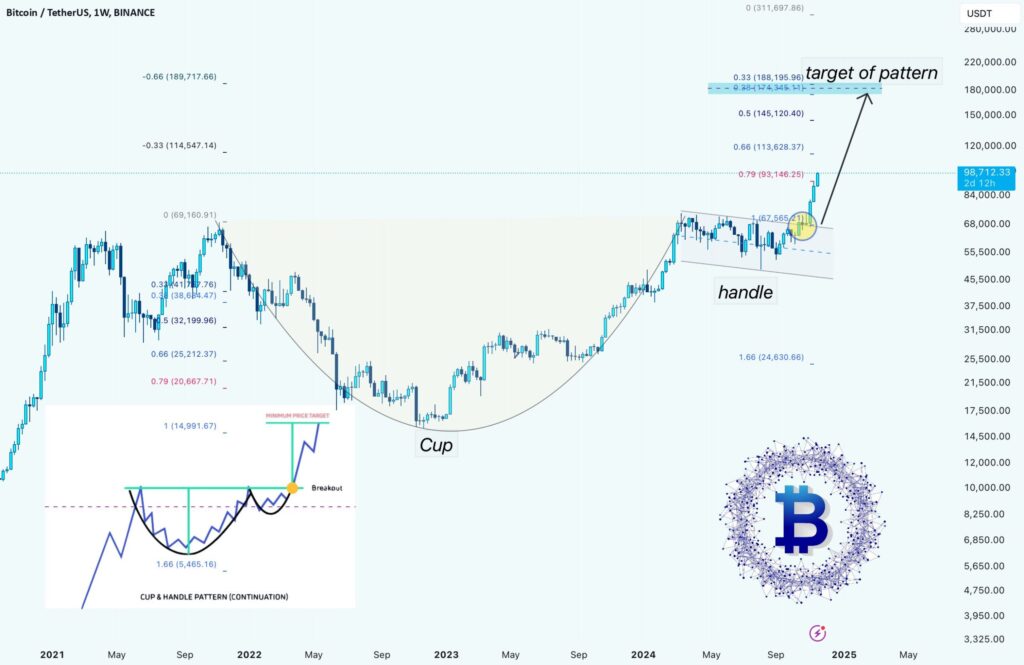
A strong rebound from this level would indicate that market sentiment remains constructive. In that scenario, Bitcoin could attempt a breakout above $97,924, opening the door to a psychological test of $100,000, and potentially even $107,500 if momentum accelerates.
Conversely, a daily close below the moving averages would suggest weakening bullish conviction. Bitcoin could then enter a consolidation phase, trading sideways within a broad range between $84,000 and $97,924 for several days. Such range-bound behavior would not necessarily be bearish in the long term; rather, it would reflect accumulation and distribution by larger market participants.
From a practical perspective, this environment favors disciplined risk management. Instead of chasing breakouts, traders may find better opportunities in range strategies, while long-term investors can view pullbacks toward major averages as potential accumulation zones.
3. Ethereum Price Outlook: Symmetrical Triangle Signals Indecision
Ethereum continues to trade within a symmetrical triangle pattern, reflecting a balance between buyers and sellers and a lack of clear directional conviction.
【Ethereum : Daily chart (symmetrical triangle)】
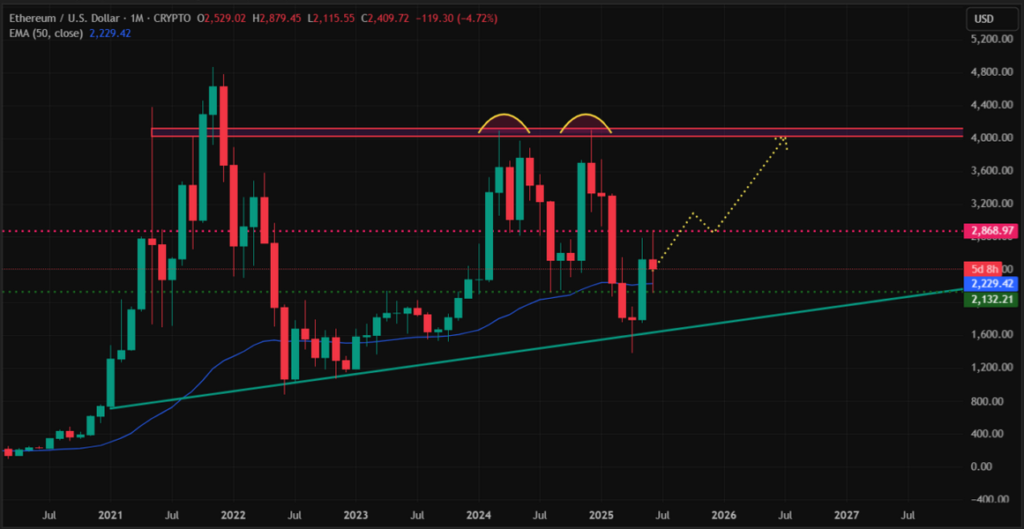
The 20-day EMA is slightly upward sloping near $3,190, while the Relative Strength Index (RSI) sits close to neutral. This combination suggests neither bulls nor bears currently hold a decisive advantage.
If ETH closes below the 20-day EMA, price action is likely to remain confined within the triangle, prolonging the consolidation phase. However, a decisive breakout above the resistance line would tilt the balance in favor of buyers, with upside targets around $3,569 and potentially $4,000.
On the downside, a breakdown below the triangle’s support line could trigger a deeper correction toward $2,623. For builders and ecosystem participants, Ethereum’s current structure highlights the importance of fundamentals beyond price—such as Layer 2 adoption, staking dynamics, and institutional use cases—while the market waits for a technical resolution.
4. XRP Price Outlook: Bears Regain Short-Term Control
XRP has slipped below its 50-day simple moving average (SMA) near $2, indicating that bearish forces are regaining influence in the short term.
【XRP : Daily chart (50-day SMA and support zone)】
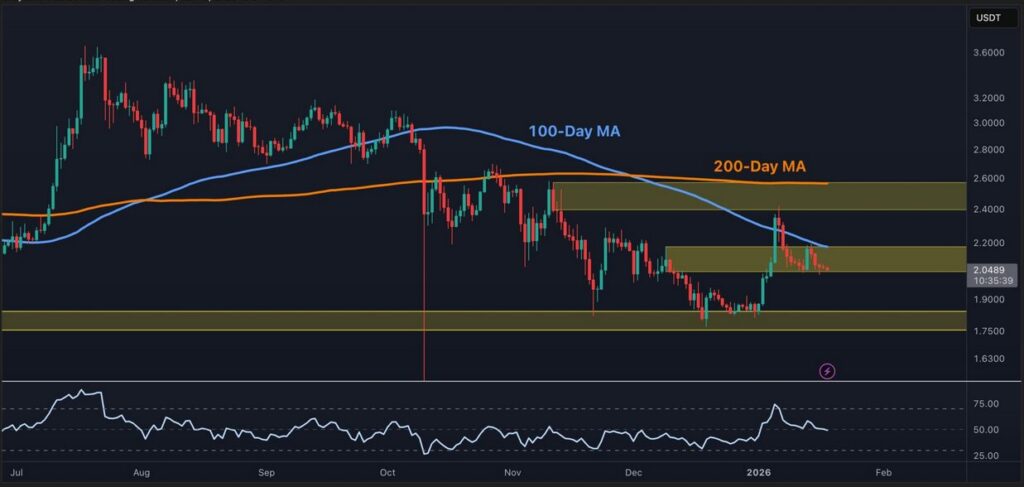
Sellers may attempt to push the price toward a strong support zone between $1.61 and the lower channel support. A sharp rebound from this zone would suggest continued range trading within the broader channel structure.
However, a daily close below the support line could accelerate selling pressure, potentially driving XRP down to $1.25, the low recorded on October 10. For bulls to signal a meaningful trend reversal, price must reclaim and hold above the descending trendline.
From a strategic standpoint, XRP’s behavior illustrates how regulatory clarity and ecosystem adoption must eventually translate into sustained demand. Until then, technical levels remain the dominant guide for market participants.
5. Solana Price Outlook: Range-Bound but Structurally Strong
Solana has retreated from resistance near $147 and fallen toward its 50-day SMA around $132, suggesting active selling pressure at higher levels.
【Solana : Daily chart (range structure)】
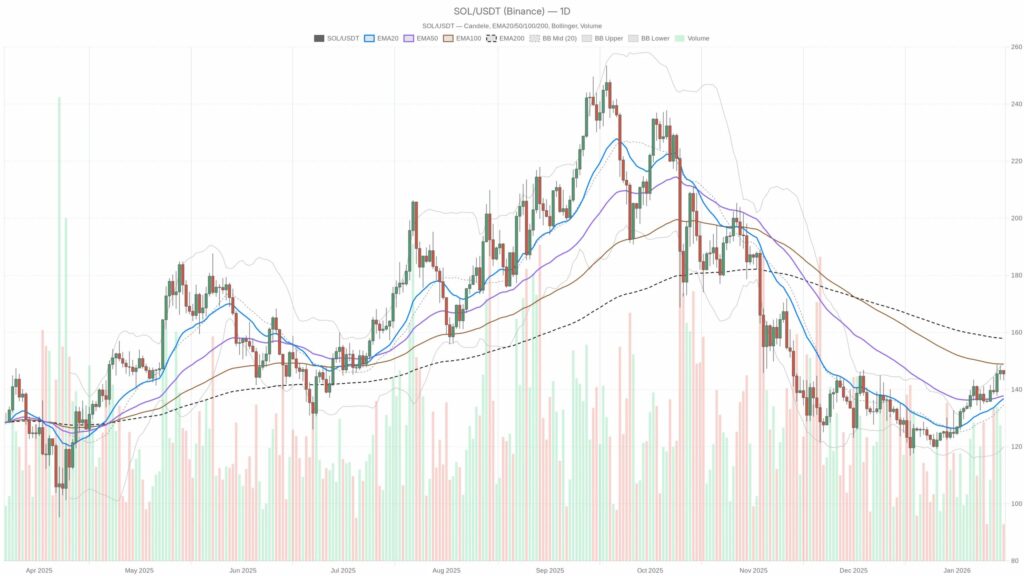
Both major moving averages are relatively flat, and the RSI hovers slightly below neutral. This configuration points to a likely consolidation range between $117 and $147 in the near term.
A breakout above $147 would signal the start of a new upward leg, with a potential target around $172. Conversely, a breakdown below $117 could expose Solana to a deeper correction toward $95.
Despite short-term uncertainty, Solana continues to attract developer activity and user adoption, particularly in high-throughput applications. For investors focused on real-world blockchain usage, periods of consolidation may offer opportunities to evaluate network fundamentals rather than react to price volatility alone.
6. Strategic Implications for Investors and Builders
Across Bitcoin, Ethereum, XRP, and Solana, a common theme emerges: uncertainty driven by macro factors is reinforcing technically defined ranges and critical support levels. This environment rewards patience, selective positioning, and a clear understanding of both technical and fundamental drivers.
For those seeking new revenue opportunities, the current phase may be less about rapid price appreciation and more about identifying infrastructure plays, yield strategies, and ecosystem participation that can perform across cycles. Crypto markets are maturing, and with that maturity comes a closer alignment with global economic realities.
Conclusion
The renewed trade war narrative has injected caution into crypto markets, pushing major assets into consolidation or testing key support levels. Bitcoin is defending its short-term trend near the 20-day EMA, Ethereum is coiling within a symmetrical triangle, XRP faces renewed bearish pressure, and Solana remains range-bound despite strong underlying interest.
Rather than signaling weakness, this period may represent a necessary pause—a phase where excess leverage is reduced and stronger foundations are built. For investors and practitioners focused on the long-term evolution of blockchain technology, such moments often provide the clearest insights into which projects and strategies are truly resilient.
