
Main Points :
- Bitcoin rebounded sharply from $62,510, with $60,000 acting as critical macro support.
- Ether remains range-bound between $1,750 and $2,111, awaiting a breakout toward $2,540.
- XRP is attempting a recovery above its 20-day EMA at $1.46, with $1.70 as the next structural test.
- Solana must reclaim $87 and then $95 to restore bullish momentum toward $117.
- Institutional flows, ETF dynamics, staking yields, and on-chain utility are increasingly influencing price structure.
- Traders and builders should view these technical levels not just as price markers, but as indicators of capital rotation and ecosystem confidence.
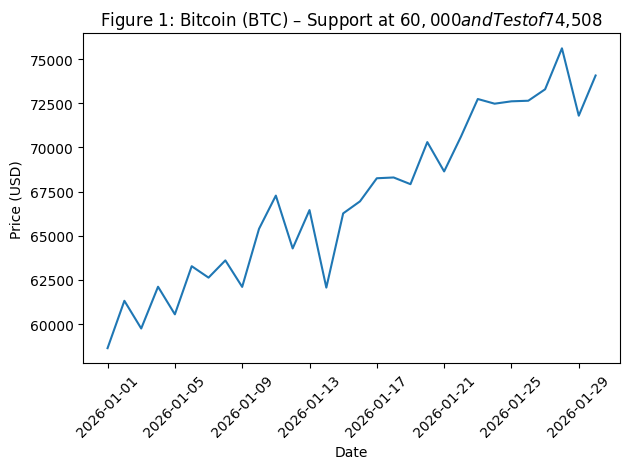
Bitcoin (BTC): Defense of $60,000 and the Battle at the 20-Day EMA
Bitcoin (BTC) staged a sharp rebound from approximately $62,510, demonstrating aggressive buying interest near the psychologically critical $60,000 level. This price zone has evolved into a structural support area where long-term holders, ETF allocators, and tactical traders converge.
The next key test lies at the 20-day Exponential Moving Average (EMA), around $69,375. A sustained close above this level would likely open the path toward $74,508 — a prior resistance zone where sellers are expected to defend aggressively.
If bulls fail to hold above the 20-day EMA and momentum reverses, downside pressure could intensify. A breakdown below $60,000 would materially weaken structure and potentially expose BTC to $52,500.
Beyond the chart, macro factors matter. Institutional ETF flows in the U.S., corporate treasury adoption, and Bitcoin’s positioning as “digital hard collateral” continue to shape structural demand. For long-term allocators, the $60,000 level represents more than technical support — it reflects balance sheet conviction.
BTC price scenario chart
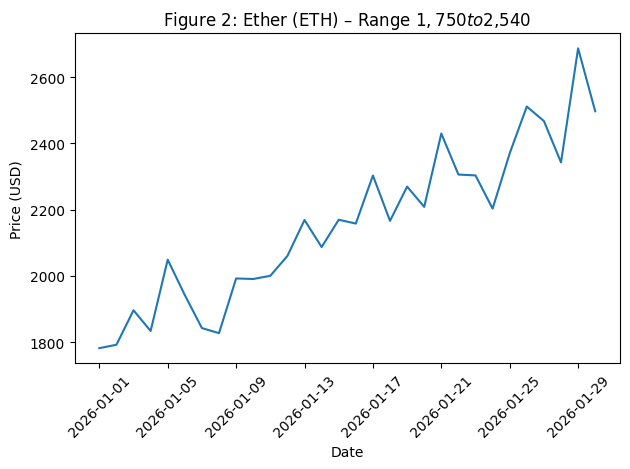
Ether (ETH): Compression Within a Defined Range
Ether rebounded from around $1,800, reinforcing the lower boundary of a $1,750–$2,111 consolidation range. The current move resembles a relief rally rather than confirmed trend reversal.
If ETH fails at $2,111 and turns lower, it may continue oscillating within the range. However, a decisive break above $2,111 would weaken seller dominance and likely trigger a rally toward the 50-day Simple Moving Average (SMA) near $2,540.
Fundamentally, Ethereum’s outlook is shaped by staking yields, Layer-2 expansion, and real-world asset tokenization growth. Institutional experimentation with tokenized funds and stablecoin settlement rails increasingly occurs on Ethereum or its rollups.
Thus, a breakout above $2,111 would not merely be technical — it could reflect renewed confidence in Ethereum’s role as programmable financial infrastructure.
ETH price scenario chart
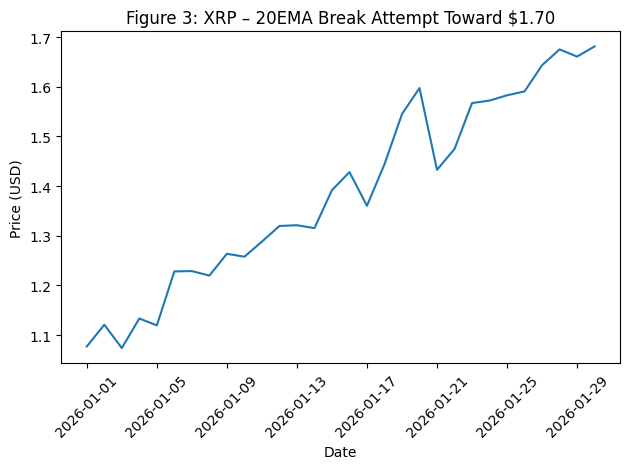
XRP: Testing the 20-Day EMA and Trendline Resistance
XRP rebounded sharply and reached its 20-day EMA near $1.46. A daily close above this level could propel price toward the 50-day SMA at $1.70 and eventually to the descending trendline that defines the broader downtrend.
Breaking that descending trendline would be structurally significant and could signal a potential trend reversal.
Conversely, if sellers defend moving averages and push price below support, XRP could revisit $1.11 and potentially the psychological $1.00 level.
Beyond price, XRP’s investment narrative hinges on cross-border settlement utility, liquidity provisioning, and regulatory clarity. Institutional payment corridors and tokenized liquidity experiments could renew strategic relevance.
XRP price scenario chart
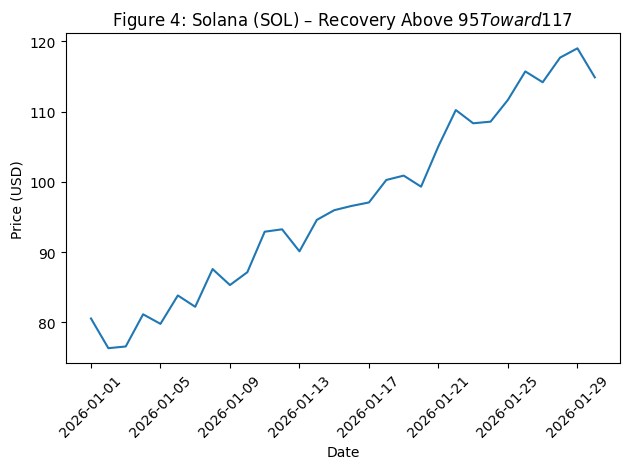
Solana (SOL): Recovery Attempt After Support Failure
Solana briefly broke below $76 support but failed to sustain lower levels, suggesting demand absorption. The immediate resistance lies at the 20-day EMA near $87.
If rejected at $87, SOL could retest $76 and possibly drop toward $67. However, reclaiming $87 would shift short-term structure, and a close above $95 would significantly strengthen bullish momentum. In that case, $117 becomes a viable upside target.
Solana’s ecosystem growth — especially in high-throughput DeFi, consumer applications, and memecoin liquidity — continues to attract speculative and venture capital.
For investors, reclaiming $95 would signal restored ecosystem confidence.
SOL price scenario chart
Strategic Interpretation for Investors and Builders
Technical levels function as liquidity magnets. But for capital allocators and blockchain operators, the deeper question is sustainability.
- Bitcoin above $60,000 reflects macro conviction.
- Ethereum above $2,111 suggests renewed DeFi and RWA momentum.
- XRP above its trendline could signal regulatory clarity translating into capital flow.
- Solana above $95 implies renewed speculative velocity.
For readers seeking new crypto assets, yield opportunities, or real-world blockchain applications, these price thresholds represent capital rotation signals.
When resistance breaks, capital reallocates. When support fails, liquidity migrates elsewhere.
Conclusion
The current market structure shows defensive strength but incomplete confirmation. Bitcoin’s $60,000 defense is constructive. Ether remains compressed. XRP is testing reversal signals. Solana is attempting momentum recovery.
Whether this rally sustains depends on:
- Institutional inflows
- ETF momentum
- On-chain utility expansion
- Macro liquidity conditions
For investors and builders alike, the key is not predicting price — but recognizing structural shifts early.
If resistance levels convert into support, the next expansion phase may begin. If supports fail, volatility will return aggressively.
In either case, disciplined strategy, diversified exposure, and ecosystem awareness remain essential.
