Main Points :
- Bitcoin is at a critical technical junction, with $90,000 acting as both a psychological and structural battleground.
- Ethereum’s breakdown from a symmetrical triangle raises short-term downside risk, but also opens the door for a potential bear trap.
- XRP remains structurally weak within a descending channel, though a trend reversal signal is forming if key resistance is reclaimed.
- Solana continues to show relative strength, with strong buyer defense at $117, suggesting institutional-grade accumulation behavior.
- Broader market conditions indicate a transition phase rather than a full bearish cycle, favoring selective positioning over blanket risk-off strategies.
Market Context: A Transitional Phase for Crypto Assets
The cryptocurrency market is currently navigating a complex transition phase. After the explosive momentum seen earlier in the cycle—driven by spot Bitcoin ETF inflows, institutional adoption, and macro liquidity expectations—prices are now consolidating under heightened volatility.
Rather than signaling a definitive bearish reversal, recent price action across major crypto assets suggests a market digesting gains, reallocating capital, and reassessing short-term valuation levels. For investors searching for new digital assets, alternative yield sources, or real-world blockchain use cases, this environment demands precision rather than speculation.
This analysis builds on recent technical observations while incorporating broader market trends, institutional behavior, and on-chain dynamics observed across multiple data providers.
Bitcoin Price Outlook: Can BTC Push Back Above $90,000?
[BTC daily chart with 20-day EMA and RSI here]
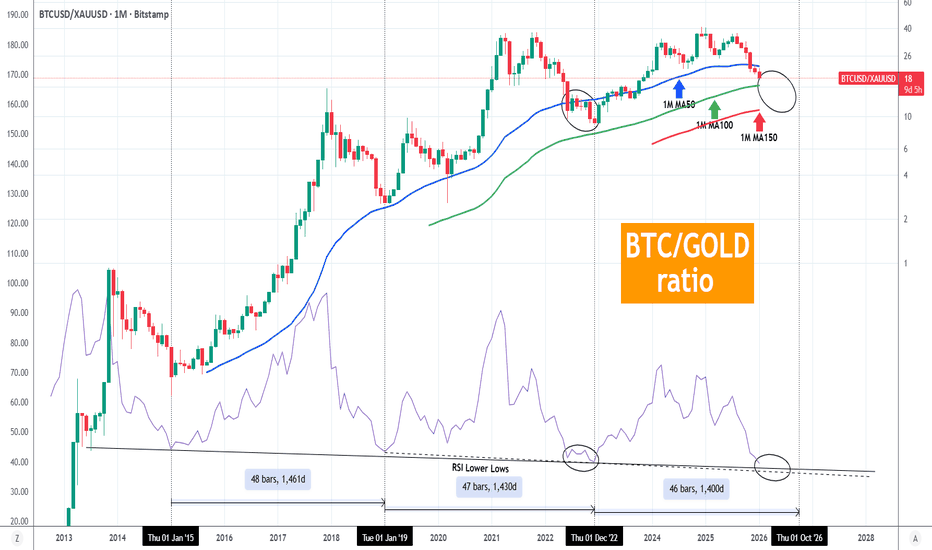
Bitcoin recently failed to hold above its 20-day exponential moving average (EMA), currently around $90,521, and subsequently broke below its rising trendline. This rejection is technically significant, as the 20-day EMA often acts as a short-term sentiment gauge during trending markets.
The downward slope of the EMA, combined with the Relative Strength Index (RSI) slipping into negative territory, indicates that bears are exerting short-term control. In previous cycles, similar configurations have often led to extended consolidation rather than immediate breakdowns.
Downside Scenarios
If Bitcoin continues to face selling pressure near its moving averages, price action may drift toward:
- $84,000, a key liquidity pocket
- $80,600, a structurally important support zone aligned with prior accumulation ranges
These levels are not arbitrary—they coincide with areas where long-term holders historically increased exposure, suggesting potential buyer re-entry rather than panic selling.
Bullish Invalidation Scenario
Conversely, a sustained breakout above the 20-day EMA would invalidate the immediate bearish thesis. In that case, Bitcoin could rapidly test the $97,924 resistance level, where significant sell-side liquidity is expected.
From a strategic perspective, Bitcoin remains less about short-term speculation and more about balance-sheet positioning, treasury hedging, and macro-aligned asset defense.
Ethereum Price Outlook: Triangle Breakdown or Bear Trap
[ETH symmetrical triangle breakdown chart here]
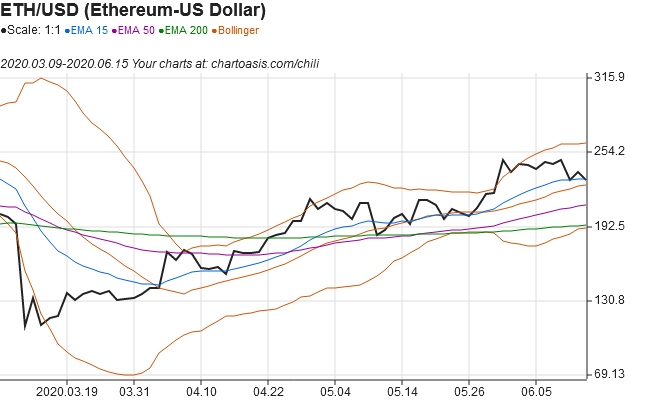
Ethereum recently broke below its symmetrical triangle pattern, a structure that typically represents equilibrium between buyers and sellers. This downside resolution suggests growing caution around Ethereum’s short-term demand dynamics.
However, technical breakdowns in mature assets like Ethereum often produce false signals—particularly when broader market liquidity remains intact.
Bearish Continuation Risk
If ETH fails to reclaim its moving averages, downside pressure could intensify toward:
- $2,623, a level closely monitored by derivatives traders and on-chain liquidity providers
A rejection at the moving averages would confirm that sellers are using rallies as exit opportunities rather than accumulation phases.
Bullish Reversal Scenario
Should buyers push ETH decisively back above its moving averages, the recent breakdown may prove to be a bear trap. In such a case, Ethereum could retest the upper boundary of the former triangle, restoring confidence among medium-term participants.
Beyond price, Ethereum’s role as the settlement layer for DeFi, tokenized assets, and enterprise blockchain applications continues to strengthen its long-term investment narrative.
XRP Price Outlook: Gradual Decline Within a Descending Channel
[XRP descending channel chart here]
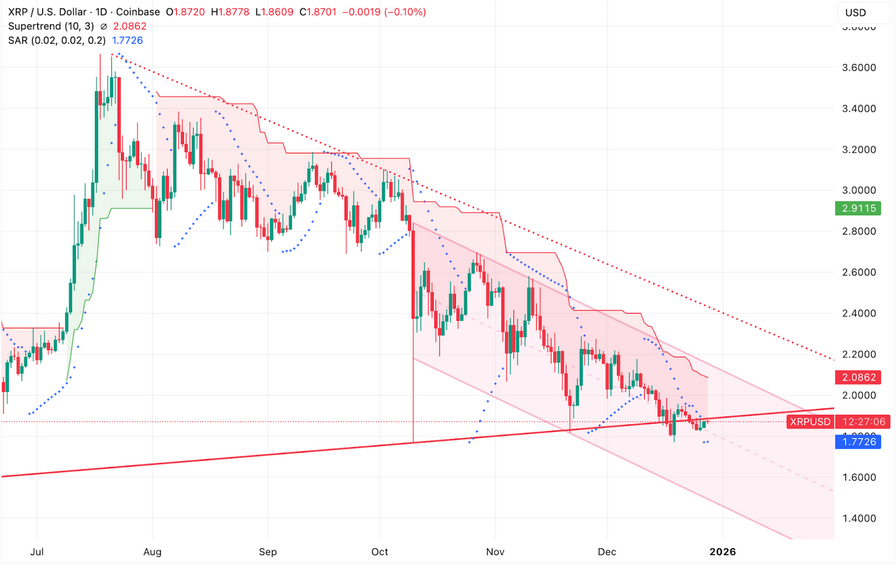
XRP remains entrenched in a descending channel, reflecting persistent selling pressure and limited speculative interest compared to other large-cap crypto assets.
Support and Resistance Dynamics
- Key support sits around $1.81
- The 20-day EMA near $1.97 continues to cap upside attempts
- A failure at the EMA could send XRP toward $1.61, a historically strong support level
Trend Reversal Signal
A decisive close above the descending trendline would signal a short-term trend reversal, potentially attracting momentum-driven capital. However, until such confirmation occurs, XRP remains more suitable for tactical trades than long-term accumulation.
Solana Price Outlook: Relative Strength and Institutional Signals
[SOL support defense and EMA chart here]
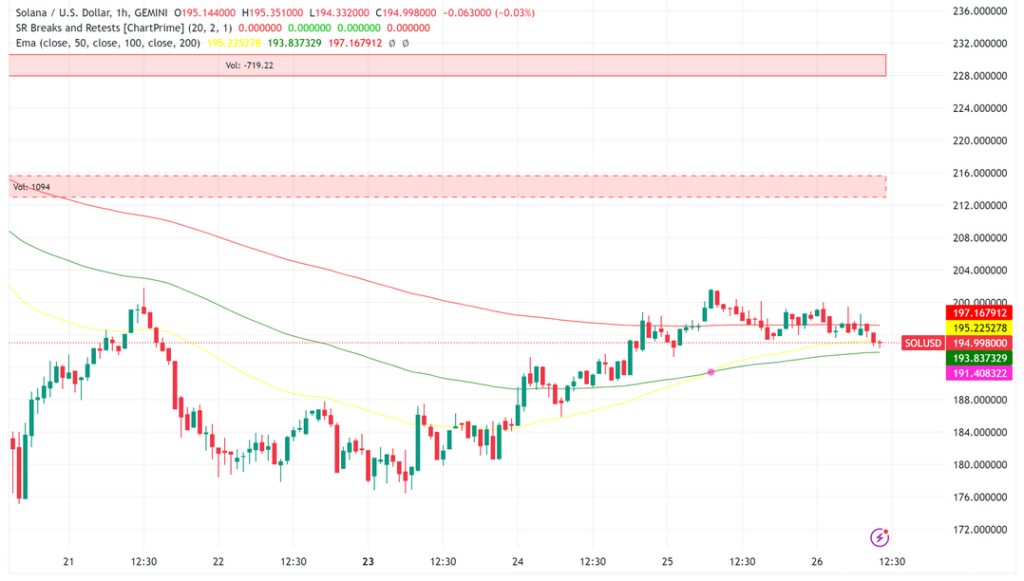
Solana has demonstrated notable resilience, rebounding from the $117 support level. This behavior suggests that buyers—potentially including institutional participants—are actively defending this zone.
Risk Scenario
If SOL fails at the 20-day EMA around $131, a retest of $117 becomes likely. A breakdown below this level could expose SOL to deeper downside toward $95, a historically significant support.
Range-Bound Strength Scenario
A successful move above the moving averages would likely keep Solana trading within a $117–$147 range, reinforcing its reputation as one of the strongest Layer 1 ecosystems in terms of developer activity, throughput, and real-world adoption.
Broader Trends: What This Means for Investors and Builders
Beyond technical charts, several macro and industry-level trends are shaping the crypto landscape:
- Institutional capital is becoming more selective, favoring infrastructure-heavy ecosystems.
- Yield generation is shifting from pure speculation toward structured products, staking, and real-world asset tokenization.
- Regulatory clarity in key jurisdictions is reducing tail risks for compliant platforms.
For readers seeking new crypto assets or practical blockchain use cases, this environment rewards disciplined analysis, portfolio segmentation, and long-term infrastructure alignment.
Conclusion: A Market of Selective Opportunity
The current crypto market is not defined by panic or euphoria, but by recalibration. Bitcoin’s battle around $90,000, Ethereum’s structural test, XRP’s gradual compression, and Solana’s relative strength all point to a market deciding its next phase.
For investors and operators alike, the message is clear: broad market bets are giving way to selective conviction. Those who understand both the technical signals and the underlying utility of blockchain networks will be best positioned for the next wave of growth.
