Main Points :
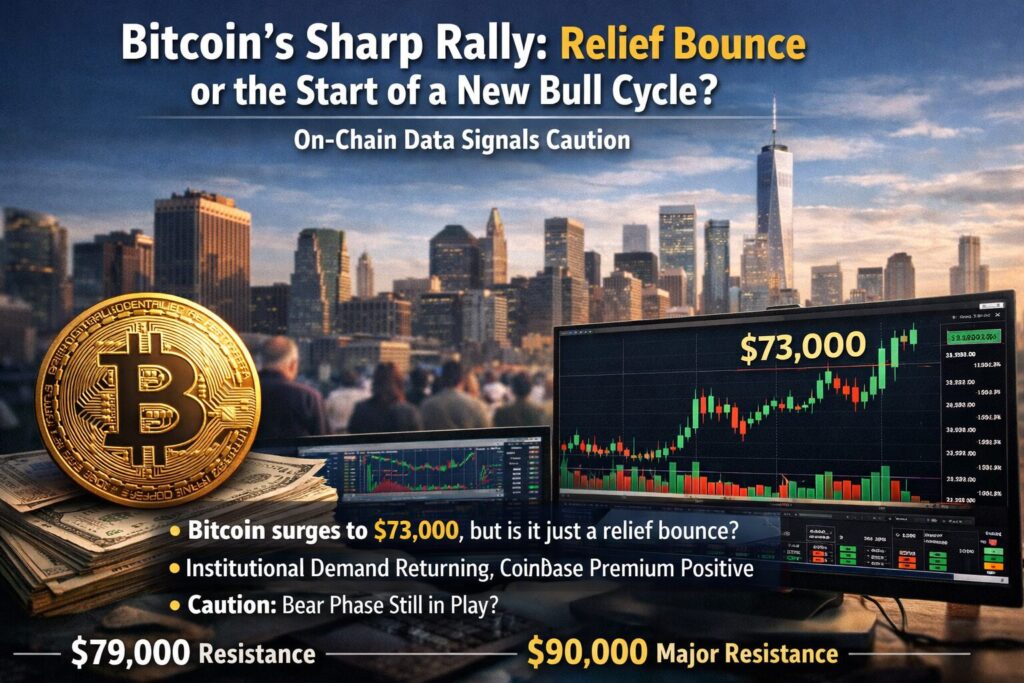
- Bitcoin surged to around $73,000, marking a one-month high after easing selling pressure in the spot market.
- On-chain data suggests the rally may be a temporary recovery within an ongoing bear phase rather than the start of a new bull market.
- Institutional demand appears to be returning, indicated by a positive Coinbase Premium.
- Trader losses and reduced selling pressure may have helped stabilize the market.
- If Bitcoin continues to rise, $79,000 and $90,000 are the key resistance zones investors should monitor.
Introduction: A Sudden Bitcoin Rally Raises New Questions
Bitcoin surprised the market with a sharp rally, climbing above $73,000 after several weeks of subdued trading. For many investors, the move raised a familiar question: Is the next bull market beginning, or is this merely a temporary rebound during a broader bearish cycle?
Recent data released by the blockchain analytics firm CryptoQuant suggests that caution may still be warranted. While several short-term indicators point to improving sentiment and easing selling pressure, the firm argues that the underlying market structure still resembles a bearish environment rather than a full recovery.
For traders and investors searching for the next profitable opportunity in the cryptocurrency market, understanding these signals is critical. Bitcoin’s trajectory often sets the tone for the entire digital asset ecosystem—from Ethereum and emerging Layer-1 chains to decentralized finance protocols and new token launches.
This article examines the recent Bitcoin rally, analyzes on-chain data and market indicators, and places the current situation within broader macro and crypto-industry trends. By doing so, it provides a clearer view of whether the market is entering a new growth phase or simply experiencing a temporary rebound.
Market Relief: Why Bitcoin Suddenly Jumped
The recent surge in Bitcoin’s price was triggered by a combination of geopolitical developments and regulatory signals.
According to market observers, two major events played a role:
- Progress in U.S. crypto legislation, particularly discussions surrounding the so-called “Clarity Act,” which aims to provide clearer regulatory frameworks for digital assets.
- Rising geopolitical tensions, including military developments involving Israel, Iran, and the United States, which historically drive investors toward alternative assets.
When traditional markets face uncertainty, Bitcoin often benefits from renewed attention as a non-sovereign store of value.
At the same time, data shows that spot market demand stabilized, helping prices recover from earlier declines. CryptoQuant estimates that the contraction in Bitcoin demand improved significantly, shrinking from approximately –136,000 BTC earlier in 2026 to around –25,000 BTC.
This shift indicates that selling pressure in spot markets has eased considerably, allowing prices to rebound.
Another key indicator supporting the rally is the Coinbase Premium, which measures the price difference between Bitcoin traded on Coinbase (a U.S. exchange) and Binance (a global exchange).
When the Coinbase Premium turns positive, it generally indicates strong buying activity from U.S. investors, particularly institutional players such as hedge funds and asset managers.
Bitcoin Price Recovery
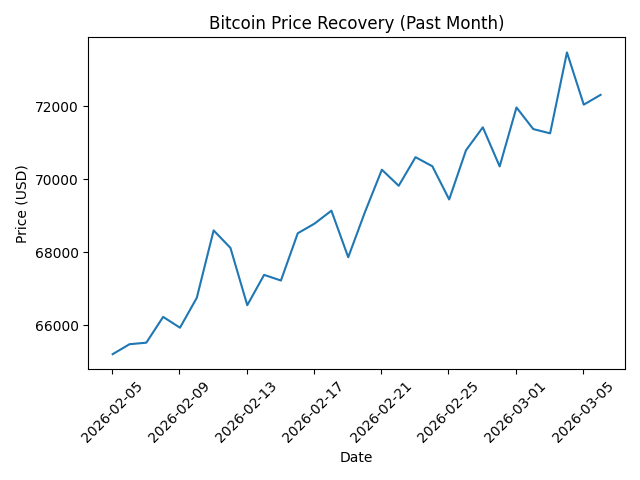
Description:
A line chart showing Bitcoin’s price movement over the past month, highlighting the rebound from the recent low to approximately $73,000.
A Market of Losses: Why Selling Pressure Is Fading
Interestingly, the recent rally occurred during a period when many traders were sitting on significant unrealized losses.
According to CryptoQuant, the level of unrealized losses among traders recently reached the highest level since July 2022. Under normal circumstances, such losses could trigger panic selling. Instead, the opposite occurred.
The reason is psychological and structural.
When the market has already declined substantially, many traders feel less incentive to sell at depressed prices, preferring to wait for recovery rather than lock in losses.
This dynamic has resulted in a noticeable decline in selling pressure from both short-term traders and long-term holders.
Data also shows that long-term holder selling activity has dropped sharply. The 30-day selling rate among long-term holders has fallen to its lowest level since June 2025.
At its peak on November 26, 2025, long-term holders sold approximately 904,000 BTC over a 30-day period. Today, that figure has declined to roughly 276,000 BTC.
This dramatic reduction suggests that many experienced investors are choosing to hold rather than exit the
Long-Term Holder Selling Decline
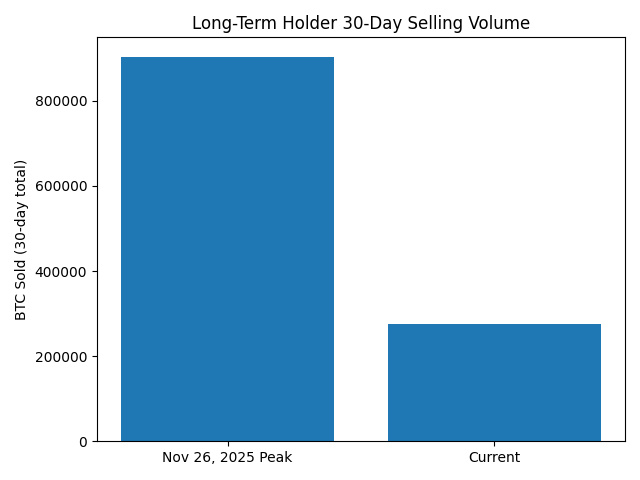
Description:
A bar chart comparing the peak selling activity of long-term holders with current levels, illustrating the sharp reduction in supply entering the market.
CryptoQuant’s Warning: The Bear Market May Still Be Intact
Despite the recent rally, CryptoQuant maintains a cautious outlook.
The firm’s proprietary Bitcoin Bull Score Index currently stands at 10 out of 100, a level that historically corresponds with deeply bearish market conditions.
The index aggregates ten key indicators, including:
- Network activity
- Profitability metrics
- Market demand
- On-chain liquidity
- Investor behavior
When the score approaches 100, the market typically enters a strong bull phase. However, readings below 40 generally indicate weak market conditions.
A score of 10 suggests that the broader market environment remains far from bullish.
From this perspective, the recent rally may represent what analysts call a “relief rally”—a temporary rise that occurs during a larger downtrend.
Relief rallies often occur when short sellers close positions or when selling pressure temporarily subsides.
However, without sustained demand and improving fundamentals, such rallies can quickly lose momentum.
Key Resistance Levels: $79,000 and $90,000
Even if Bitcoin continues its upward trajectory, analysts believe the market will soon face significant resistance levels.
The first major barrier sits around $79,000.
This level corresponds with the lower boundary of Bitcoin’s on-chain realized price zone, which represents the average acquisition price of market participants.
Historically, during bear markets, this zone often functions as a strong resistance level where rallies stall.
If Bitcoin manages to break through this barrier, the next major resistance lies around $90,000.
This level represents the upper boundary of the realized price zone.
In fact, it already acted as resistance earlier this year. In mid-January, Bitcoin rallied from roughly $80,000 to $98,000, but the $90,000 area marked the beginning of a consolidation phase.
Bitcoin Resistance Levels
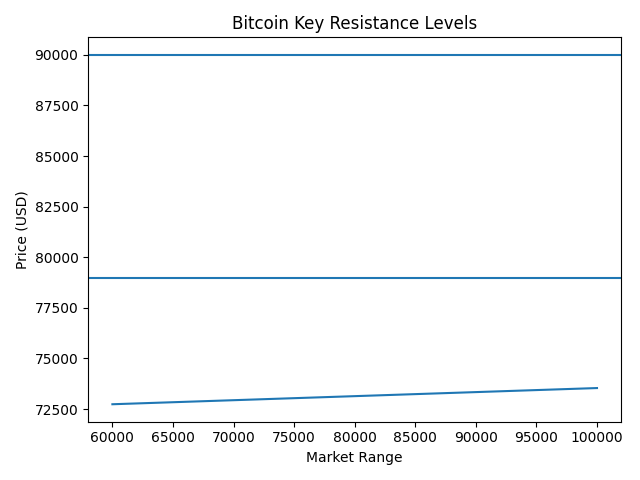
Description:
A technical chart illustrating the $79,000 and $90,000 resistance zones based on on-chain realized price bands.
Broader Market Context: Institutional Capital and ETFs
Beyond on-chain data, broader macro trends are shaping Bitcoin’s trajectory.
One major factor is the continued expansion of institutional investment vehicles, particularly spot Bitcoin ETFs.
Since their approval in major markets, Bitcoin ETFs have attracted tens of billions of dollars in capital, dramatically altering market liquidity.
Large asset managers increasingly treat Bitcoin as a portfolio diversification asset, similar to gold or commodities.
In addition, major financial institutions—including banks and payment networks—are expanding their crypto services.
This growing integration between traditional finance and blockchain technology could eventually support long-term structural demand for Bitcoin.
The Opportunity for Crypto Investors
For investors searching for new profit opportunities, the current environment presents both risks and possibilities.
If Bitcoin remains trapped within a bear-market structure, traders may see volatile sideways movements rather than sustained growth.
However, such conditions often create opportunities in several areas:
- Altcoin rotation – Capital frequently flows from Bitcoin into smaller assets during recovery phases.
- DeFi yield strategies – Lending, staking, and liquidity provision can generate income during stagnant markets.
- Early-stage token investments – New blockchain ecosystems often gain traction when market sentiment stabilizes.
Understanding Bitcoin’s position within the broader market cycle is therefore essential for identifying where the next wave of opportunities may emerge.
Conclusion: A Critical Moment for Bitcoin
Bitcoin’s recent rally above $73,000 has renewed optimism among traders and investors.
However, on-chain data suggests that the market may still be navigating a fragile recovery within an ongoing bearish cycle.
Key signals—including the extremely low Bull Score Index of 10—indicate that fundamental market strength remains limited.
For Bitcoin to truly transition into a new bull market, several conditions must be met:
- Sustained institutional demand
- Stronger network activity
- Breakouts above major resistance levels
The $79,000 and $90,000 zones will likely serve as critical tests for the market in the coming months.
If Bitcoin successfully breaks these levels, it could signal the beginning of a new expansion phase. If not, the market may remain trapped in a prolonged consolidation period.
For investors focused on the next generation of digital assets and blockchain applications, the key takeaway is clear:
Bitcoin remains the heartbeat of the crypto economy.
Understanding its cycles is essential for identifying the next major opportunity in the rapidly evolving world of decentralized finance.
