Key Points :
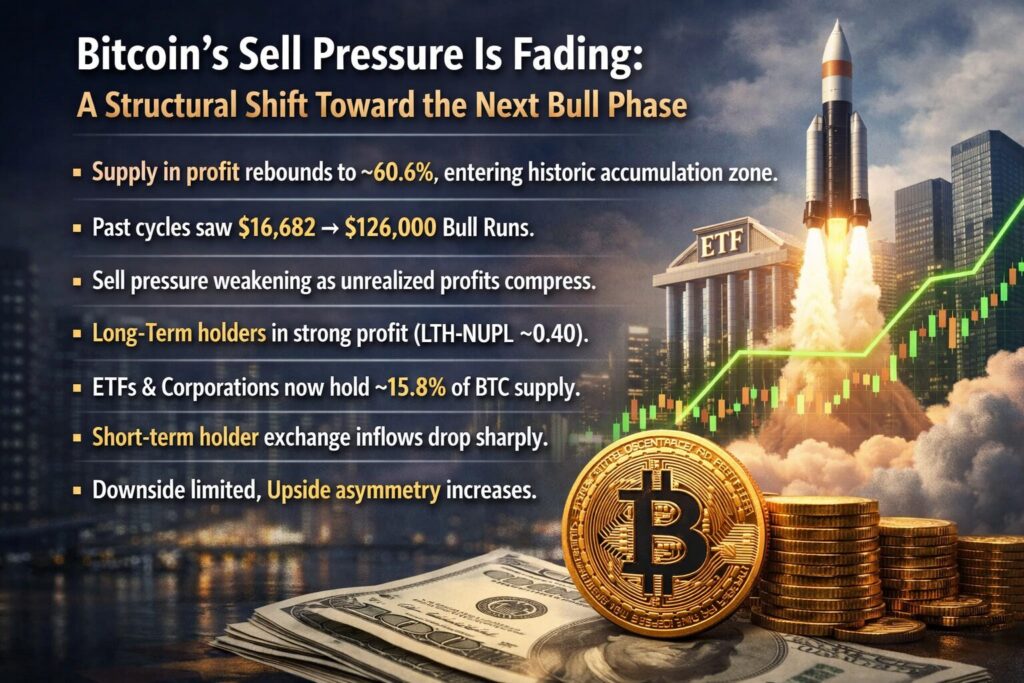
- Bitcoin’s “supply in profit” has rebounded to ~60.6%, entering a historical accumulation zone.
- Past cycles show similar levels often precede major bull runs (e.g., $16,682 → $126,000).
- Sell pressure is weakening as unrealized profits compress across holders.
- Long-term holders remain in strong profit (LTH-NUPL ~0.40), unlike previous bear-market bottoms.
- Structural change: ETFs and corporations now hold ~15.8% of BTC supply, reducing volatility.
- Exchange inflows from short-term holders have dropped significantly, signaling reduced panic selling.
- Valuation metrics suggest downside is limited while upside asymmetry increases.
1. Market Reset in Motion: Understanding “Supply in Profit”
One of the most important on-chain indicators currently shaping Bitcoin’s outlook is the “supply in profit”—the percentage of circulating BTC held at a price below the current market level. As of the latest data, this metric has reached approximately 60.6%, placing Bitcoin in a historically significant range associated with market resets and early-stage accumulation.
Earlier this year, on February 5, the metric dropped to 50.8%, marking its lowest level since January 2023. At that point, nearly half of all Bitcoin holders were either at breakeven or in unrealized loss. This condition is psychologically and structurally important: when investors are no longer sitting on large profits, the incentive to sell diminishes significantly.
Historically, this “profit compression zone” has acted as a transition phase rather than a final bottom. It represents a point where weak hands have largely exited, and stronger hands begin accumulating. The current rebound into the 60% range suggests that Bitcoin is moving out of the capitulation phase and into a re-accumulation phase.
2. Historical Cycles: When Pain Precedes Opportunity
Bitcoin’s past cycles provide strong context for interpreting current data. In January 2023, when Bitcoin was trading at approximately $16,682, the supply in profit was around 51%. From that point, the market eventually surged to approximately $126,000—an increase of roughly 655%.
A similar pattern occurred in March 2020, when Bitcoin traded near $6,500 and the supply in profit fell below 50%. This marked the COVID-induced market bottom. Within a year, Bitcoin reached $69,000, delivering one of the most aggressive bull runs in financial history.
These examples highlight a recurring dynamic: when the majority of investors are no longer in significant profit, selling pressure declines, and the market becomes structurally ready for upward expansion.
3. Why Sell Pressure Is Declining
The 50–60% supply-in-profit range has historically corresponded to a unique equilibrium state. In this zone, most holders are near their cost basis, meaning unrealized profits are minimal. As a result, the psychological urge to “lock in gains” weakens.
At the same time, those who entered at higher prices are less likely to sell at a loss unless forced. This creates a supply-side contraction, where fewer coins are actively available for sale. The result is a market environment where even modest demand can drive prices upward.
However, it is important to clarify that this indicator does not directly signal a price bottom. Instead, it defines a structural zone where downside risk is reduced and accumulation becomes dominant.
4. The Role of Long-Term Holders (LTH-NUPL)
Another critical metric is the Long-Term Holder Net Unrealized Profit/Loss (LTH-NUPL). In previous bear markets—such as 2015, 2018, and 2022—Bitcoin bottoms were formed when this metric turned negative, indicating that even long-term investors were underwater.
Today, the situation is markedly different. The LTH-NUPL remains around 0.40, indicating that long-term holders are still sitting on significant unrealized profits. This suggests that the market has not experienced the same level of capitulation seen in prior cycles.
This divergence points to a fundamental shift: Bitcoin is maturing as an asset, and its investor base is becoming more resilient. Long-term holders are no longer forced sellers, even during corrections.
5. Structural Shift: ETFs and Corporate Accumulation
Perhaps the most important development in the current cycle is the structural transformation of Bitcoin ownership. Corporations and spot ETFs now control approximately 15.8% of the circulating supply—equivalent to roughly 3.32 million BTC.
Entities such as BlackRock and Fidelity Investments have introduced institutional-grade Bitcoin exposure through regulated ETF products. These players typically operate with long-term investment horizons and are less sensitive to short-term price volatility.
This shift has several implications:
- Reduced sell pressure during downturns
- Increased price stability
- A higher baseline for demand due to passive inflows
Unlike previous cycles, where retail-driven panic selling dominated, the presence of institutional capital dampens extreme downside movements.
6. Exchange Flows Confirm the Trend
On-chain exchange data further supports the thesis of declining sell pressure. Short-term holder inflows to major exchanges like Binance have dropped significantly.
On March 25, inflows fell to approximately 25,000 BTC, down sharply from nearly 100,000 BTC during the sell-off in early February. This indicates that reactive selling by newer investors is subsiding.
Lower exchange inflows typically correlate with reduced immediate selling pressure, as fewer coins are being moved into liquid trading environments.
7. Valuation Metrics Signal Asymmetric Opportunity
Several widely followed valuation indicators reinforce the idea that Bitcoin is entering a favorable risk-reward zone:
- MVRV (Market Value to Realized Value) below 1
- NUPL below -0.2 (historically associated with undervaluation)
- Puell Multiple near 0.35 (indicating miner stress and reduced issuance pressure)
While none of these metrics can pinpoint an exact bottom, they collectively suggest that downside risk is limited. More importantly, they highlight a growing asymmetry: the potential upside significantly outweighs the remaining downside.
For investors seeking new opportunities, this is precisely the type of environment where long-term positions are typically built.
8. Insert Figure 1 Here: Bitcoin Supply in Profit (%)
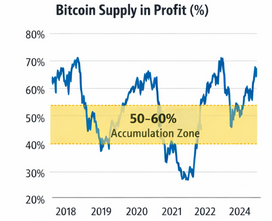
[Line chart showing Bitcoin Supply in Profit (%) over time, highlighting the 50–60% accumulation zone]
9. Insert Figure 2 Here: LTH-NUPL Trend
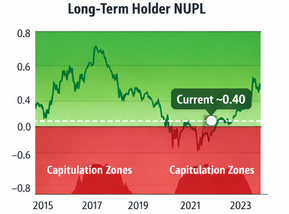
[Chart of Long-Term Holder NUPL showing current ~0.40 vs historical negative zones]
10. Insert Figure 3 Here: Exchange Inflows (Short-Term Holders)
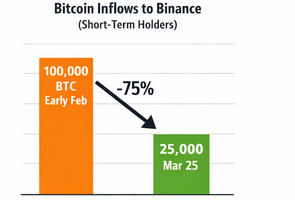
[Bar chart comparing Binance inflows (100k BTC → 25k BTC)]
11. What This Means for Investors and Builders
For investors, the current environment presents a compelling narrative: Bitcoin is transitioning from a phase of weak-hand capitulation to strong-hand accumulation, supported by structural demand from institutions.
For builders and operators in the blockchain space—especially those developing wallets, exchanges, or payment systems—this shift is equally significant. Reduced volatility and stronger long-term holders create a more stable foundation for real-world applications.
Projects focused on practical utility—such as remittances, decentralized finance, and cross-border payments—are likely to benefit from this evolving market structure.
12. Conclusion: A New Type of Cycle Is Emerging
Bitcoin’s current positioning reflects more than just a typical cycle reset—it signals a transformation in how the market functions. The combination of reduced sell pressure, resilient long-term holders, and institutional accumulation suggests that future bull markets may unfold differently from the past.
Rather than sharp boom-and-bust cycles driven by retail speculation, we may be entering an era of more gradual, structurally supported growth.
For those seeking the next wave of opportunity in crypto, the message is clear: the foundations are being laid not just for another rally, but for a more mature and sustainable market.
