Main Points :
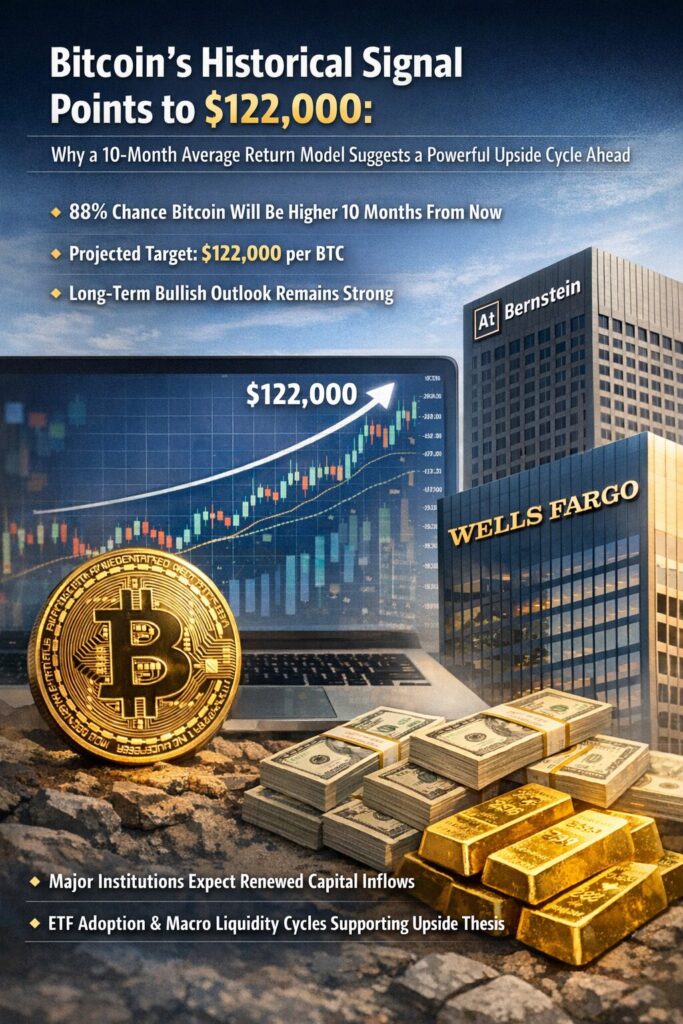
- A long-term historical frequency model suggests an 88% probability that Bitcoin will be higher 10 months from now.
- The model’s “average return” projection implies a potential price of $122,000 per BTC.
- Despite weak short-term sentiment, long-term bullish forecasts remain intact.
- Major institutions such as Bernstein and Wells Fargo foresee renewed capital inflows into Bitcoin and risk assets.
- Structural factors—ETF adoption, institutional treasury allocations, and macro liquidity cycles—continue to support a medium-term upside thesis.
1. A Historical Frequency Model Signals a Strong 10-Month Upside
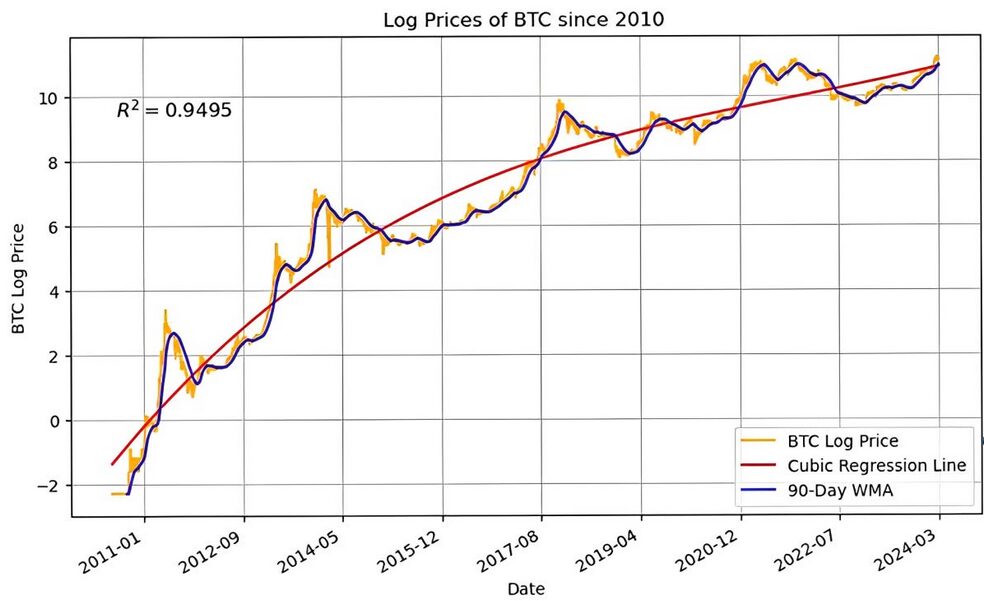
If history were to repeat itself, Bitcoin (BTC) could reach approximately $122,000 within the next 10 months, based on a long-term historical signal highlighted by network economist Timothy Peterson.
Peterson’s analysis examines Bitcoin’s monthly performance over the past two years and extends the dataset back to 2011. According to his findings, 50% of the last 24 months closed positive, which statistically implies that the probability of Bitcoin trading higher 10 months from now stands at approximately 88%.
Rather than forecasting price volatility directly, Peterson’s so-called “unofficial” indicator measures the frequency of positive months. This distinction is important. The model does not attempt to predict how violently price will move—it instead measures how often upward momentum tends to cluster over time.
He calculates the average return as:
exp(60%) − 1 ≈ 82%
Applied to the current price structure, that corresponds to a projected average price level of approximately $122,000 per BTC.
Importantly, this data spans cycles dating back to 2011, meaning it incorporates multiple bull and bear markets, halvings, macro tightening phases, and liquidity expansions.
2. Not a Price Target Model—But an Inflection Detector
Peterson previously clarified that historical performance models are less useful for pinpointing exact price targets and more valuable for identifying inflection points—moments when momentum shifts direction.
Because this indicator measures frequency rather than magnitude, it can decline even if Bitcoin trades sideways for several months. Yet its real power lies in recognizing when the broader structural trend is shifting from contraction to expansion.
In previous Bitcoin cycles:
- 2012–2013: Early expansion following accumulation
- 2016–2017: Post-halving exponential rally
- 2020–2021: Institutional adoption phase
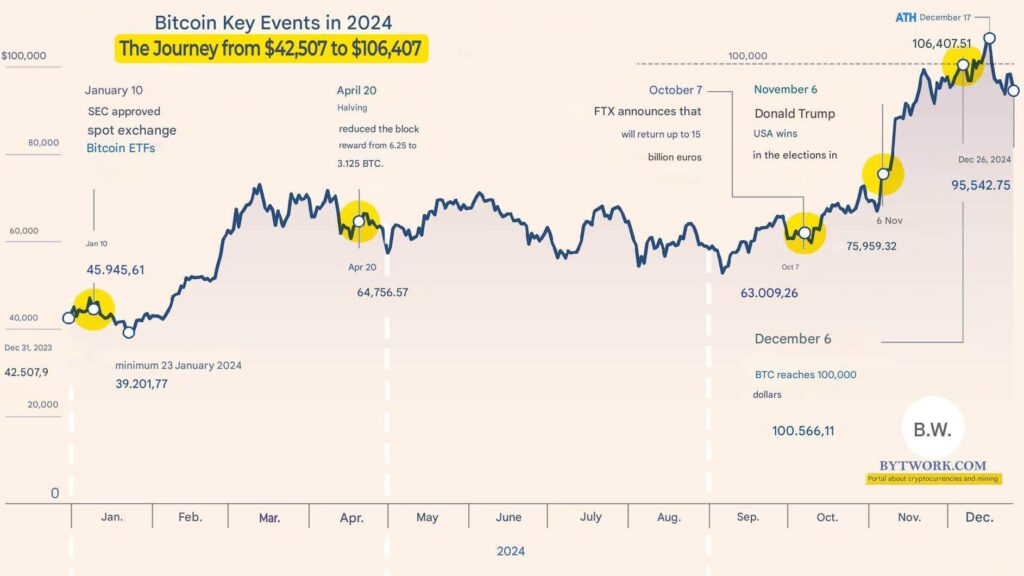
- 2023–2024: ETF-driven structural demand shift
The model suggests we may currently be transitioning into another expansionary phase.
3. Sentiment Is Cold—But Structure Remains Bullish
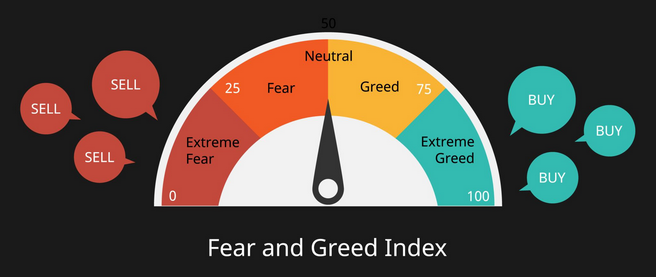
Despite bullish statistical projections, current market sentiment remains subdued.
A recent poll conducted by Peterson on X revealed persistent bearish bias among retail participants. This disconnect—weak sentiment combined with structurally positive data—has historically preceded strong upside moves.
In financial markets, extreme pessimism often forms the base of large rallies. When positioning is light and expectations are low, it requires less marginal capital to push price higher.
4. Institutional Analysts Maintain Aggressive Price Targets
Other market participants continue to maintain strong upside projections into 2026.
Bernstein: $150,000 Target
Research from Bernstein recently described Bitcoin’s current correction as the “least aggressive bear case in history,” assigning a $150,000 target.
Wells Fargo: $150 Billion Capital Rotation
Wells Fargo projects that by the end of Q1, approximately $150 billion could flow into Bitcoin and equities combined. Increased savings rates and renewed speculative appetite may drive this capital rotation.
Analyst Austin Kwon noted:
“Speculation is likely to accelerate alongside rising savings. Investors may return to a YOLO (‘You Only Live Once’) risk-on posture.”
These institutional views align with the frequency model’s probabilistic upside bias.
5. Macro Liquidity and Bitcoin’s Structural Evolution
Beyond historical frequency data, broader macro forces support a bullish medium-term thesis:
1. Liquidity Cycles
Bitcoin historically correlates with global M2 liquidity expansion. Should central banks pivot toward easing, risk assets—including BTC—tend to benefit.
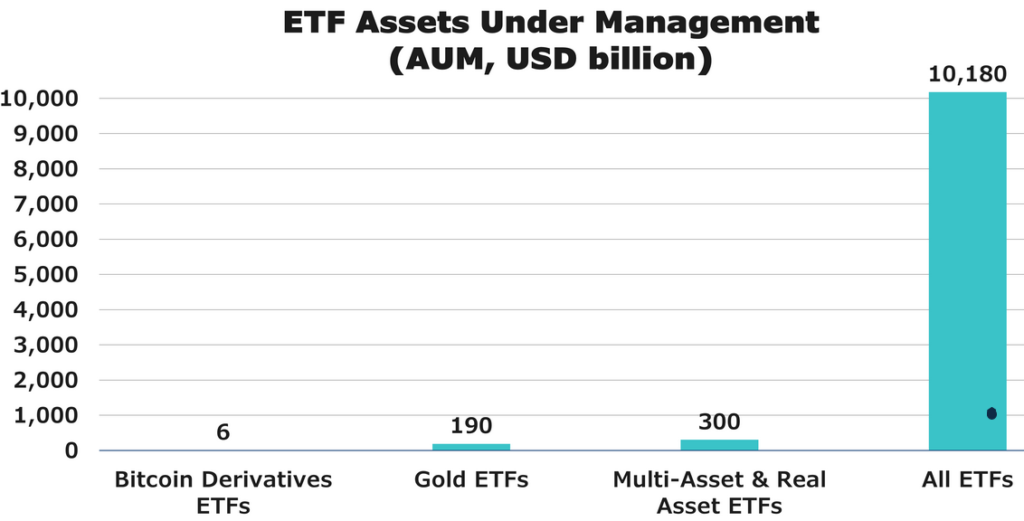
2. Spot ETF Structural Demand
Spot Bitcoin ETFs have permanently altered market structure by:
- Providing institutional access
- Creating daily demand flows
- Reducing circulating supply via custody
3. Treasury Adoption
Corporate treasury allocation to Bitcoin continues gradually. Even a small percentage shift from global corporate cash reserves could significantly impact supply-demand balance.
6. Risk Considerations
No model guarantees outcome. The 88% probability is derived from historical frequency, not deterministic forecasting.
Risks include:
- Prolonged macro tightening
- Regulatory shocks
- Liquidity crunch
- ETF outflows
- Geopolitical instability
However, current on-chain metrics suggest long-term holders remain inactive sellers, historically a precursor to supply shock environments.
7. What $122,000 Actually Represents
An 82% average return translating to $122,000 does not imply a straight-line move.
It suggests:
- A recovery above previous resistance
- Renewed speculative participation
- Acceleration once prior highs are reclaimed
- Momentum traders re-entering
Historically, Bitcoin’s largest gains occur in compressed time windows following extended consolidation.
8. Strategic Implications for Investors
For readers seeking:
- New crypto assets
- Yield opportunities
- Practical blockchain applications
Bitcoin’s trajectory matters because it sets the liquidity backdrop for the entire ecosystem.
When BTC trends upward:
- Altcoins outperform
- Venture capital flows increase
- DeFi yields expand
- On-chain experimentation accelerates
The probability-based model therefore serves as a macro allocation signal rather than a short-term trade trigger.
Conclusion: History Does Not Repeat—But It Rhymes
Bitcoin’s historical frequency data suggests an 88% probability of higher prices within 10 months, with an implied average price near $122,000.
While short-term sentiment remains cautious, institutional forecasts, ETF structural demand, and macro liquidity conditions align with a renewed expansion thesis.
No indicator guarantees outcome—but when multiple independent signals converge, probability skews meaningfully.
If the historical pattern holds, the coming cycle may once again reward patience over panic.
