
Main Points :
- Bitcoin’s recent rebound toward $70,000 lost momentum after rejection at the 200-week EMA and the prior 2021 all-time high level.
- Short-term liquidity below $69,000 was cleared, but buyers failed to sustain upside continuation.
- Historical bear market cycles suggest that declaring the end of the downturn may be premature.
- Current drawdown from the $126,200 all-time high stands near 53%, compared to historical averages of roughly 80%.
- Traders remain cautious across both short-term and long-term timeframes.
- For investors seeking new crypto opportunities and practical blockchain revenue models, disciplined positioning and cycle awareness are critical.
The $70,000 Rejection: A Technical Barrier That Still Holds
Bitcoin (BTC) began to give back its recent gains as Wall Street trading opened, with bullish momentum fading just below the psychologically important $70,000 level. The rally, which briefly pushed BTC to approximately $70,040, encountered stiff resistance at two key technical levels: the 200-week exponential moving average (EMA) and the previous 2021 all-time high.
Data from TradingView showed BTC/USD dropping more than 1% on the day, bringing the $67,000 region back into focus. While bulls attempted to reclaim lost support, the market structure suggested hesitation rather than conviction.
Rekt Capital noted that the 200-week EMA is currently acting as resistance. Historically, Bitcoin trading below this long-term trendline has often preceded additional downside or prolonged consolidation. As long as BTC remains under this indicator, statistical precedent suggests caution rather than celebration.
[BTC/USD Weekly Chart with 200-Week EMA Resistance – Image file provided separately]
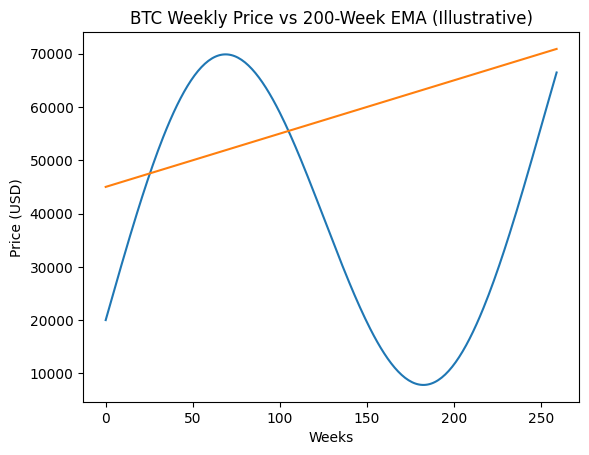
This rejection is not merely a short-term fluctuation. The 200-week EMA has served as a macro-cycle inflection point throughout Bitcoin’s history. Breaking above it decisively has often signaled structural trend shifts. Failing at it, by contrast, frequently extends the bear phase.
Liquidity Sweeps and the Failure to Sustain Momentum
According to liquidity analysis from trading resource TheKingfisher, price action swept liquidity clusters below $69,000 before exhausting upside pressure. In practical terms, this means that short positions were likely liquidated, stop orders were triggered, and the market harvested available leverage before stalling.
Such liquidity sweeps are common in transitional market phases. They often create the illusion of breakout momentum before reverting. For short-term traders, this environment can be profitable but also dangerous, particularly if leverage is mismanaged.
Trader Jelle summarized the situation succinctly: the rally hit prior cycle highs and a 12-hour trendline, then was rejected. The broader trend remains intact. His conclusion—“slow and steady”—reflects a wider market mood.
For investors seeking yield or next-cycle opportunities, these false breakouts serve as reminders: momentum without structural confirmation can be deceptive.
Is It Too Early to Call the Bottom?
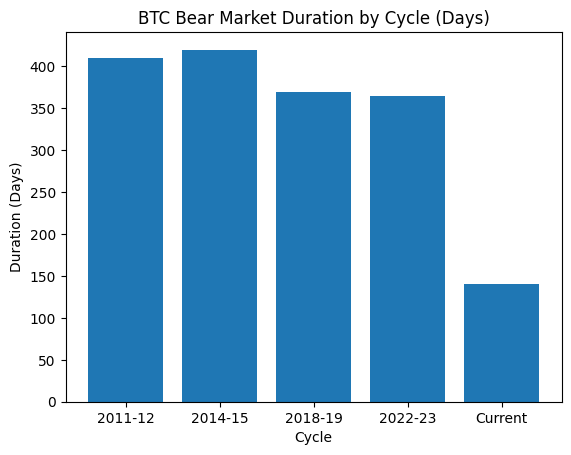
Rekt Capital argues that it is likely premature to declare the bear market finished. Historically, even Bitcoin’s shortest bear markets lasted approximately 365 days. The current downturn has been underway for around 140 days—less than half of that minimum historical duration.
[BTC Drawdown from All-Time High – Percentage Comparison Across Cycles – Image file provided separately]
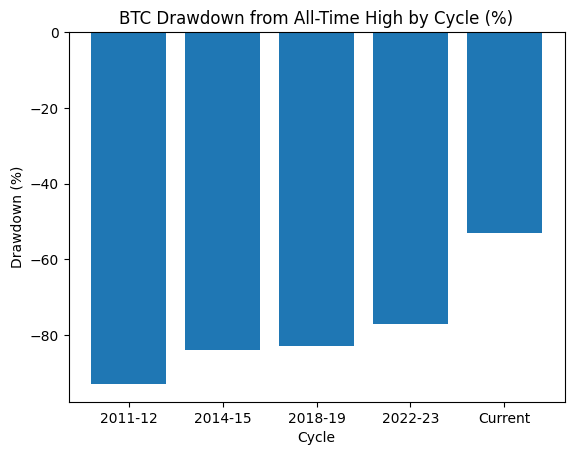
At the February low, Bitcoin had fallen approximately 53% from its $126,200 all-time high reached in October 2025. Historically, prior bear markets have seen drawdowns closer to 80%.
This statistical discrepancy fuels skepticism. If past cycles serve as precedent, further volatility—or even deeper retracements—cannot be ruled out.
Trader Roman emphasized this perspective, warning against premature optimism. One rebound does not constitute structural reversal. Monthly and weekly charts, he noted, still lack confirmed bullish divergence or macro-trend shifts.
For cycle-based investors, this raises a key question: is this consolidation before expansion, or merely mid-cycle relief?
Historical Bear Market Context: Patterns and Probabilities
Bitcoin’s past major bear cycles (2011–2012, 2014–2015, 2018–2019, 2022–2023) demonstrate several recurring characteristics:
- Prolonged duration exceeding one year.
- Deep drawdowns near or beyond 75%.
- Extended accumulation ranges before breakout.
- High volatility with repeated failed rallies.
While the current macro environment differs—spot ETF approvals in the U.S., institutional custody expansion, and broader regulatory clarity in multiple jurisdictions—price psychology often remains cyclical.
[Graph 3: Historical Bear Market Duration and Drawdown Comparison – Image file provided separately]
Recent developments across the crypto ecosystem add complexity. Institutional participation has increased dramatically, with major asset managers offering regulated Bitcoin exposure. Simultaneously, on-chain data shows long-term holders maintaining relatively stable supply control, while short-term holders exhibit more reactive behavior.
This structural shift could moderate extreme drawdowns—or it could compress cycle timelines.
Broader Market Trends: Institutionalization vs. Volatility
Beyond technical analysis, macro forces continue shaping Bitcoin’s trajectory.
- Spot Bitcoin ETFs have expanded liquidity access.
- Large financial institutions are integrating blockchain-based settlement systems.
- Stablecoin adoption for cross-border payments is accelerating.
- Layer-2 infrastructure development is reducing transaction friction.
For readers seeking practical blockchain applications and revenue models, these trends matter.
Bitcoin itself may be experiencing cyclical turbulence, but the broader ecosystem is evolving rapidly:
- Tokenization of real-world assets (RWAs) is expanding.
- On-chain derivatives markets are growing.
- Non-custodial wallet infrastructure is improving.
- Institutional-grade compliance tooling is becoming standardized.
Even within a bear market framework, capital rotates. Historically, bear markets have been incubation phases for infrastructure innovation.
Strategic Implications for Investors Seeking New Opportunities
For investors hunting new digital assets or yield strategies, several implications arise:
1. Patience Over Aggression
Macro bear phases reward disciplined accumulation more than leveraged speculation.
2. Liquidity Awareness
Liquidity sweeps near key resistance levels can create short-term opportunities but also trap breakout chasers.
3. Diversified Exposure
While Bitcoin remains the macro anchor, emerging sectors—such as modular blockchains, restaking protocols, and tokenized treasury products—may outperform during transitional phases.
4. Risk-Adjusted Thinking
Position sizing relative to historical drawdown probabilities (up to 80%) remains prudent.
5. Structural Confirmation Matters
Weekly and monthly trend shifts carry more significance than intraday volatility.
The Psychological Dimension: Why False Hope Repeats
Every Bitcoin bear cycle includes moments when markets believe “the bottom is in.” These are often fueled by:
- Short squeezes
- Positive regulatory headlines
- Institutional announcements
- Macroeconomic easing signals
Yet structural trend reversals require time, accumulation, and capital rotation.
This pattern reflects human behavior as much as technical structure. Optimism returns faster than capital confidence.
Conclusion: Discipline in a Transitional Phase
Bitcoin’s rejection near $68,000–$70,000 underscores that the market remains in a technically fragile position. The 200-week EMA continues to act as a macro resistance level. Historical bear cycle duration and drawdown data suggest caution against declaring victory too early.
However, bear markets are not merely periods of decline—they are periods of strategic positioning. For investors seeking the next revenue stream or practical blockchain deployment opportunity, the key is distinguishing between short-term noise and long-term structural transformation.
While the bear market may not yet be definitively over, the broader blockchain ecosystem continues advancing. Those who combine patience, cycle awareness, and risk discipline may find that transitional phases offer the most asymmetric long-term opportunities.
In summary, Bitcoin’s recent rally toward $70,000 does not yet invalidate the broader corrective structure. Until macro resistance levels are decisively reclaimed and historical cycle metrics align with prior bottoms, prudence remains warranted. Yet within that prudence lies opportunity—for those prepared to navigate volatility intelligently.
