Main Points :
- Bitcoin is consolidating below the $74,500 resistance, forming a potential bullish ascending triangle.
- If Bitcoin breaks the resistance, the next target could reach $84,000.
- Ethereum shows signs of trend reversal if it holds above the $2,036 EMA.
- XRP is strengthening after reclaiming its 20-day EMA, suggesting weakening selling pressure.
- Solana is approaching a range breakout near $95, which could trigger a move toward $117.
- Institutional capital inflows, macro liquidity trends, and ETF momentum continue to support the broader crypto market.
Introduction: A Market Pausing Before the Next Move
The cryptocurrency market is once again approaching a critical moment. After a strong rally earlier this year, Bitcoin has begun to slow its upward momentum near a major resistance zone around $74,500. This hesitation is not necessarily a sign of weakness. In many cases, such consolidation phases serve as a launchpad for the next major price movement, particularly when supported by strong technical indicators and improving macroeconomic sentiment.
At the same time, several major altcoins—including Ethereum, XRP, and Solana—are showing early signals that their respective downtrends may be ending. Technical indicators across multiple timeframes suggest that buying pressure is gradually increasing, even though sellers remain active near key resistance levels.
Recent macroeconomic data has also contributed to this market environment. The U.S. Personal Consumption Expenditures (PCE) inflation index, one of the Federal Reserve’s preferred inflation indicators, recently aligned with market expectations. Stable inflation readings tend to improve investor sentiment toward risk assets such as cryptocurrencies, because they reduce the likelihood of aggressive monetary tightening.
In addition, institutional demand for digital assets remains robust. Large asset managers continue accumulating Bitcoin, and crypto exchange-traded funds (ETFs) have recorded significant inflows throughout the year. These developments reinforce the long-term thesis that cryptocurrencies are evolving from speculative assets into strategic components of diversified investment portfolios.
Against this backdrop, technical analysis of major cryptocurrencies provides important insights into where the market may be heading next.
Bitcoin Price Analysis: Consolidation Below a Major Breakout Level
Bitcoin recently climbed toward $74,508, a level that has proven to be a strong resistance barrier. At this price range, bearish traders stepped in aggressively, preventing the cryptocurrency from continuing its upward move.
Despite this resistance, several indicators suggest that the overall market structure remains favorable for bulls. The 20-day Exponential Moving Average (EMA), currently near $69,271, has flattened rather than turning downward. Meanwhile, the Relative Strength Index (RSI) remains in positive territory.
These signals indicate that buyers still maintain a structural advantage.
If Bitcoin successfully breaks above the $74,508 resistance, it would complete a bullish ascending triangle pattern, one of the most widely recognized continuation patterns in technical analysis.
A confirmed breakout could trigger a rapid move toward approximately $84,000, representing the next significant psychological and technical target.
However, bearish traders still have a potential counter-strategy. If they manage to push Bitcoin below the triangle’s support line, momentum could reverse quickly. In that scenario, the BTC price might decline toward the $62,500–$60,000 support zone, where stronger buying interest previously emerged.
Overall, Bitcoin appears to be in a decision phase. The next breakout—either upward or downward—will likely determine the direction of the broader cryptocurrency market in the coming weeks.
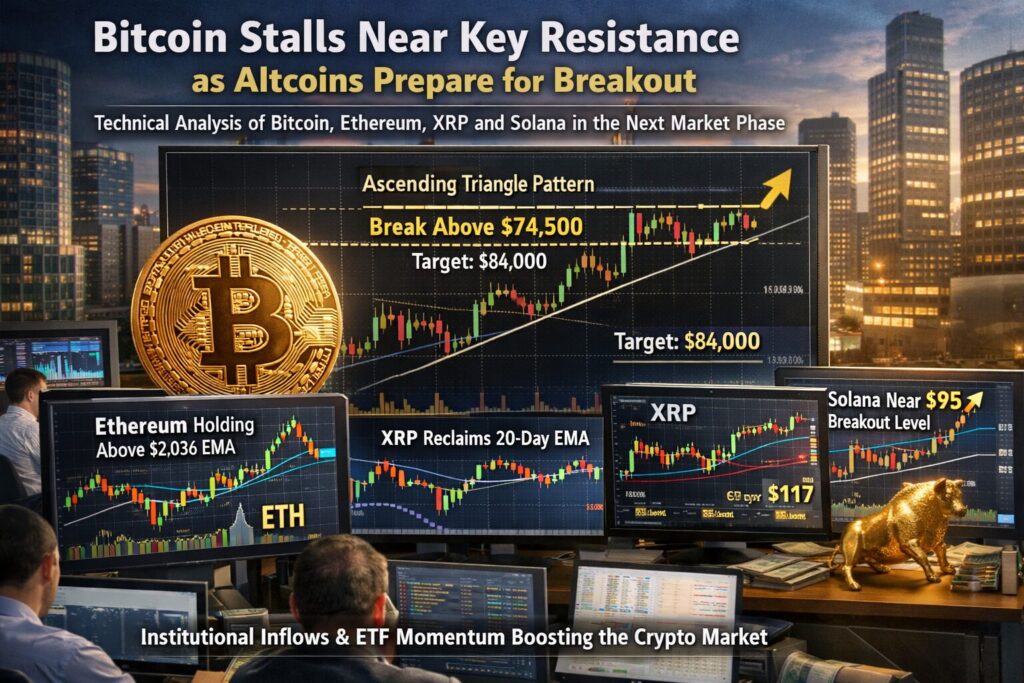
Figure 1 – Bitcoin Resistance and Breakout Scenario
This chart illustrates:
- Ascending triangle formation
- Resistance around $74,500
- Potential breakout target near $84,000
Ethereum Price Analysis: Attempting to Confirm a Trend Reversal
Ethereum, the second-largest cryptocurrency by market capitalization, is also entering an important technical phase.
Currently, sellers are attempting to stop Ethereum’s recovery rally near the 50-day Simple Moving Average (SMA), around $2,173. This level has historically acted as a dynamic resistance during downward trends.
However, buyers continue to defend the 20-day EMA near $2,036, suggesting that the market’s underlying sentiment may be shifting.
If Ethereum manages to maintain price stability above the 20-day EMA, the probability of a continued upward move toward $2,600 increases significantly.
Such a move would also imply that Ethereum’s previous downtrend may have officially ended, opening the door for a broader recovery across the altcoin market.
Nevertheless, bearish traders may attempt an alternative scenario. If Ethereum’s price quickly falls back below the 20-day EMA, the asset could return to a sideways trading range between $1,750 and $2,200.
This consolidation pattern would reflect uncertainty among market participants and could delay a decisive breakout.
Ethereum therefore remains in a transitional phase, where either bullish continuation or extended consolidation remains possible.
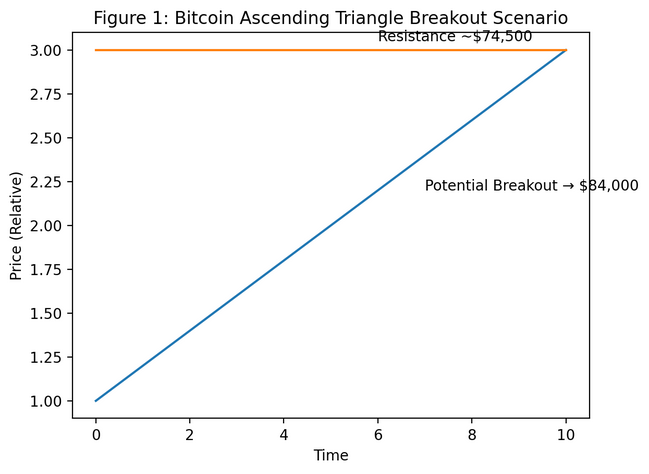
Figure 2 – Ethereum Support and Recovery Structure
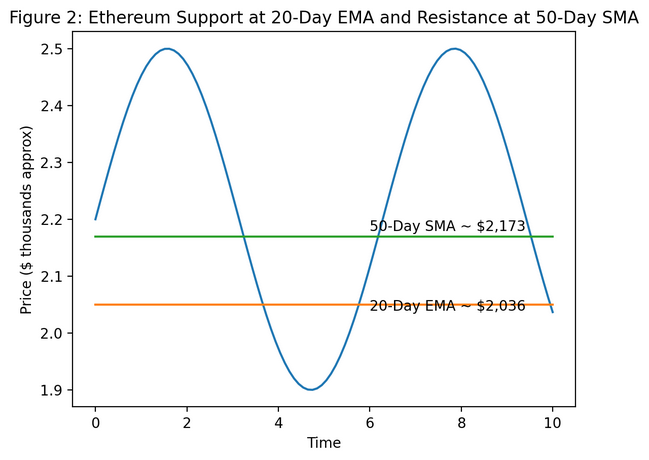
Diagram highlights:
- 20-day EMA support near $2,036
- 50-day SMA resistance near $2,173
- Potential breakout target near $2,600
XRP Price Analysis: Selling Pressure Begins to Fade
XRP, one of the most widely used cryptocurrencies for cross-border payment systems, is showing early signs that selling pressure is weakening.
The asset recently climbed above its 20-day EMA near $1.39, indicating that buyers are gradually regaining control.
During the current recovery rally, selling pressure is expected to appear near two key levels:
- $1.49 (50-day SMA)
- $1.61 (major resistance zone)
If XRP’s price declines from these levels but finds support again at the 20-day EMA, it would signal a significant shift in market psychology.
The trading sentiment could transition from “sell the rally” to “buy the dip.”
In such a scenario, XRP could attempt a climb toward the upper boundary of its descending channel, potentially initiating a broader recovery.
However, the bullish scenario would be invalidated if XRP falls below $1.27. A breakdown below this level could trigger a sharp decline toward the channel’s lower support line.
The next several days will therefore be crucial in determining whether XRP transitions into a recovery phase or continues its consolidation.
Figure 3 – XRP Channel Structure and Recovery Scenario
The diagram shows:
- Descending channel structure
- EMA support near $1.39
- Potential breakout trajectory
Solana Price Analysis: Gradual Climb Toward Range Breakout
Solana has been steadily climbing within a trading range between $76 and $95, indicating a gradual reduction in selling pressure.
If buyers successfully push the price above the $95 resistance level, the next major target could reach approximately $117.
This breakout would confirm that Solana’s consolidation phase has ended and that bullish momentum is returning.
However, sellers are likely to defend the $117 level strongly, making it a critical resistance zone in the medium term.
Interestingly, if Solana manages to break above $95 and later retests this level as support, it would provide strong evidence that a short-term market bottom has formed.
Conversely, if the price sharply reverses downward near $95, it would suggest that bearish traders still maintain control. In that case, Solana could continue fluctuating within the $76–$95 range for several more days.
Figure 4 – Solana Range Breakout Structure
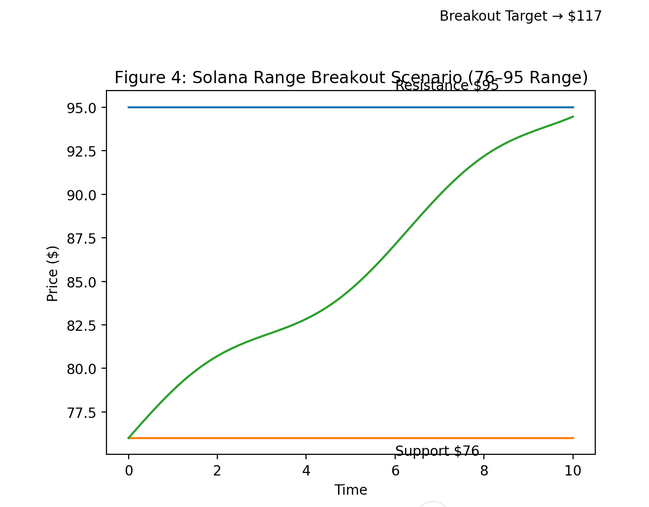
Key elements illustrated:
- Trading range between $76 and $95
- Breakout target near $117
Broader Market Context: Institutional Capital and Liquidity Trends
Beyond individual price charts, the cryptocurrency market continues to benefit from several broader macro trends.
Institutional capital flows into Bitcoin have remained strong, particularly following the introduction of spot Bitcoin ETFs in multiple markets. Large asset managers are increasingly viewing Bitcoin as a digital store of value comparable to gold.
At the same time, global liquidity conditions are gradually improving as central banks approach the later stages of their monetary tightening cycles.
These factors support the possibility that the current consolidation phase in cryptocurrencies may represent a pause within a larger long-term uptrend.
Altcoins also tend to benefit from Bitcoin stability. Historically, when Bitcoin consolidates after a rally, capital often rotates into alternative digital assets such as Ethereum, Solana, and XRP.
This phenomenon—often referred to as an “altcoin season”—could emerge if Bitcoin successfully breaks above its current resistance.
Figure 5 – Crypto Market Rotation Cycle
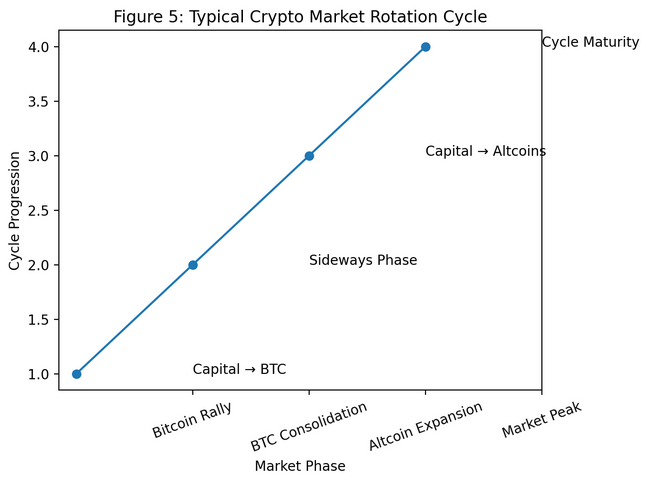
Diagram showing:
- Bitcoin rally
- Bitcoin consolidation
- Altcoin breakout phase
Conclusion: A Market at the Edge of Its Next Expansion Phase
The cryptocurrency market currently stands at a critical technical crossroads.
Bitcoin’s consolidation below $74,500 suggests that a major breakout could be approaching. A move above this level may accelerate the price toward $84,000, potentially igniting renewed momentum across the entire digital asset sector.
Ethereum appears close to confirming a trend reversal, while XRP is beginning to regain bullish momentum. Solana, meanwhile, is approaching a potential range breakout that could signal the start of another upward cycle.
At the same time, macroeconomic stability, institutional investment, and expanding blockchain adoption continue strengthening the long-term foundations of the cryptocurrency ecosystem.
For investors seeking new crypto assets, emerging revenue opportunities, and practical blockchain applications, the coming weeks may offer some of the most important signals of the year.
If current technical patterns resolve to the upside, the market may soon transition from consolidation into the next expansion phase of the digital asset cycle.
