Main Points :
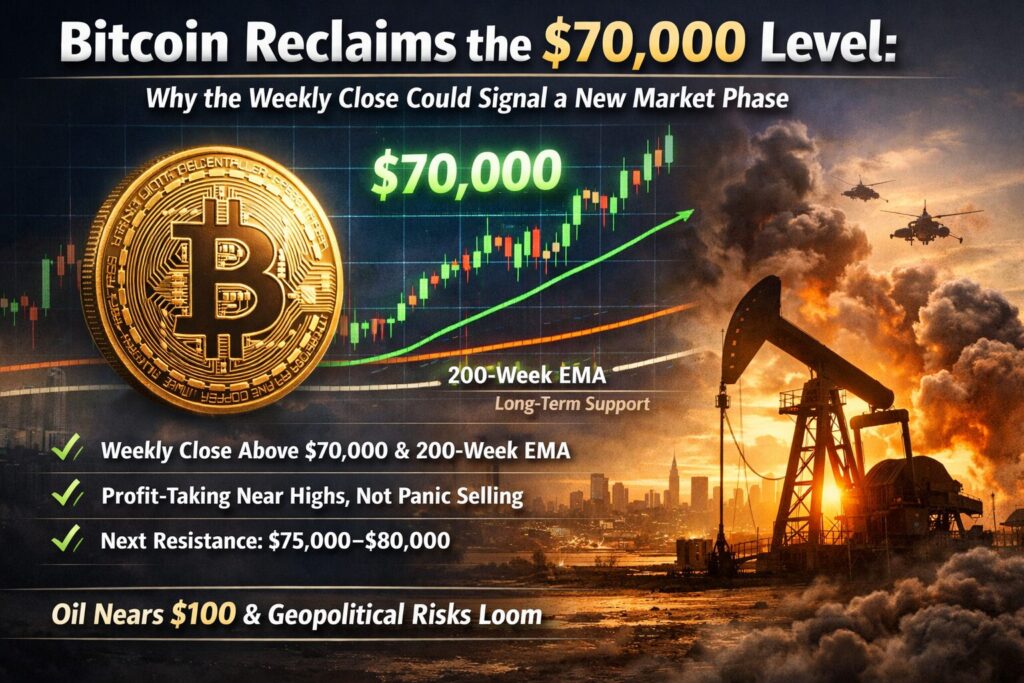
- Bitcoin is attempting to secure a weekly close above $70,000, a key psychological and technical level.
- A weekly close above this range would mean reclaiming the long-term support trendline and the 200-week EMA near $68,300.
- Analysts suggest current selling pressure near highs is gradual profit-taking rather than panic selling.
- The next major resistance range is expected around $75,000–$80,000.
- Macroeconomic factors—including oil prices approaching $100 per barrel and geopolitical instability—remain potential risks to the rally.
Bitcoin Attempts to Recover Long-Term Support
Bitcoin (BTC) is once again testing a decisive moment in its market cycle as the price pushes above $70,000 and attempts to secure a strong weekly close above this level. This development has drawn significant attention from traders and analysts because the $70,000 mark represents more than a psychological milestone—it also aligns with several important technical indicators that define long-term market structure.
According to data from TradingView, Bitcoin briefly surged to nearly $72,000 during weekend trading before stabilizing slightly below that level. Despite the short-term cooling in price, the move upward has already established one of the strongest daily closes in over a week, continuing a sequence of bullish momentum that has been building since early March.
Perhaps most importantly, Bitcoin is currently trading above two major technical benchmarks. The first is the 200-week exponential moving average (EMA), located around $68,300. Historically, this level has acted as a powerful long-term support zone that separates bullish market phases from extended bearish cycles. The second is the previous all-time high from 2021, around $69,400, which had previously acted as a major resistance level before being surpassed earlier in the current cycle.
Holding above these levels suggests that Bitcoin may be reclaiming structural support that could sustain higher prices in the coming months.
Bitcoin Weekly Trend and 200-Week EMA Support
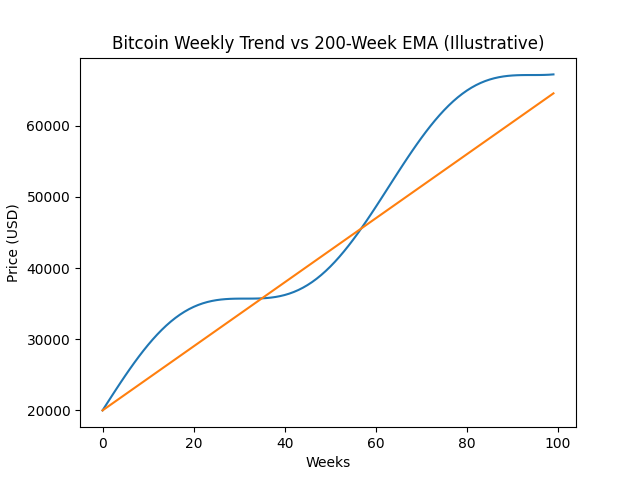
(Chart showing BTC price relative to the 200-week EMA and $70k level)
Seven Consecutive Bullish Daily Candles
Another technical signal drawing attention is Bitcoin’s formation of seven consecutive bullish daily candles. Such a sequence indicates strong buying pressure and persistent demand across multiple trading sessions.
Seven green candles in a row rarely occur in mature markets like Bitcoin unless strong institutional or macro-driven buying is present. Historically, similar patterns have appeared during the early phases of major bull market expansions.
This pattern also reflects a broader shift in market sentiment. After several months of sideways consolidation earlier in the year, buyers appear to be regaining confidence that the upward trend remains intact.
Crypto trader Michaël van de Poppe recently suggested that the brief correction seen on Friday was not a structural weakness but simply a risk-off move ahead of the weekend, when traders often reduce exposure due to lower liquidity and potential geopolitical developments.
In his analysis, he noted that the market quickly resumed upward momentum once trading volumes stabilized.
CME Gap and the Path Toward $75,000–$80,000
One factor influencing short-term price movements is the well-known phenomenon known as the CME gap. Bitcoin futures traded on the Chicago Mercantile Exchange close during weekends, which can create gaps between Friday’s closing price and Sunday’s reopening.
Traders frequently anticipate that Bitcoin will revisit these gaps before continuing its broader trend.
In this case, the CME futures market had closed near $71,325, and analysts predicted that the spot market would return to that level to “fill the gap.” That prediction proved accurate, reinforcing the technical framework used by many professional traders.
Looking ahead, the next major resistance zone is expected between $75,000 and $80,000.
Breaking into this range could signal the beginning of a new acceleration phase, particularly if macroeconomic conditions remain favorable.
Bitcoin Price Momentum and CME Gap
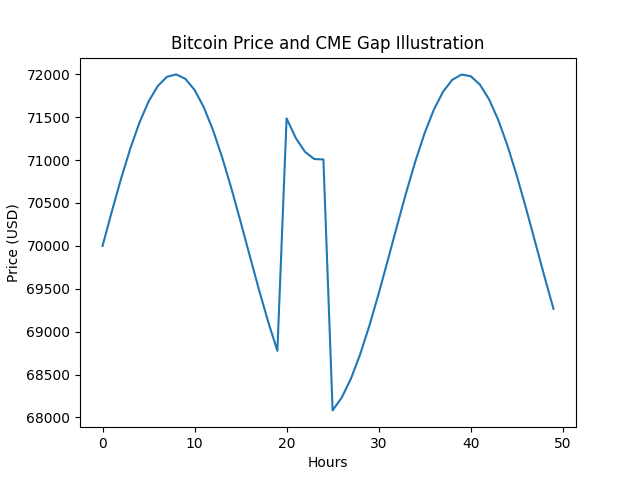
(Chart illustrating the CME gap around $71k and subsequent price revisit)
Profit-Taking Near Local Highs
Despite the strong upward momentum, the market is not moving in a straight line. Bitcoin continues to face selling pressure each time it approaches or surpasses $70,000.
However, analysts emphasize that this selling does not appear to be panic-driven.
Instead, it reflects gradual profit-taking by traders who accumulated positions earlier in the cycle.
Kyle Doops, a crypto market analyst, described this behavior as a normal component of healthy market structure. According to his analysis, sellers entering the market above $70,000 are simply locking in profits after earlier price gains rather than attempting to trigger a large-scale reversal.
This distinction is important because panic selling typically leads to rapid price collapses and cascading liquidations. Profit-taking, by contrast, tends to create temporary pauses in an otherwise upward trend.
Defining Bitcoin’s Current Trading Range
According to Doops, Bitcoin’s medium-term trading range can currently be defined by two key metrics derived from on-chain data.
The upper boundary is approximately $78,400, representing the “true market average price.” This level reflects the aggregate cost basis of many active market participants.
The lower boundary is around $54,400, representing the realized price of the circulating supply. Realized price is a metric that calculates the average acquisition cost of all coins currently in circulation, weighted by the price at which they last moved on-chain.
These two levels effectively create a broad valuation corridor for Bitcoin’s price.
Within this corridor, market participants continuously negotiate price through cycles of accumulation and distribution.
Bitcoin Long-Term Trading Range
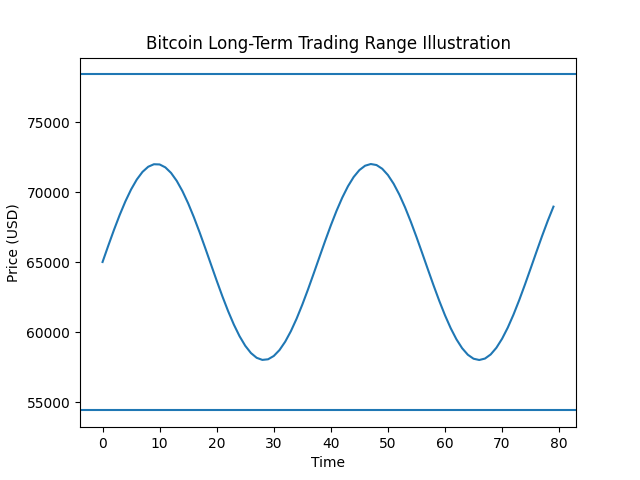
(Chart illustrating the $54k realized price and $78k market average band)
Macroeconomic Risks: Oil, Inflation, and Geopolitics
While Bitcoin’s technical structure appears strong, macroeconomic conditions remain an important variable that could influence the trajectory of the market.
One major factor currently drawing attention is the sharp rise in global oil prices. West Texas Intermediate (WTI) crude oil futures have been approaching $100 per barrel, reflecting ongoing supply disruptions and geopolitical tensions.
Higher oil prices can influence the cryptocurrency market through several channels.
First, rising energy costs can contribute to inflation, which affects central bank policy decisions. If inflation accelerates, central banks may delay interest rate cuts or even consider tightening monetary policy.
Second, geopolitical tensions—often linked to energy supply disruptions—can increase overall financial market volatility.
Some analysts believe that Bitcoin may benefit from such instability because it is increasingly viewed as a hedge against monetary debasement and geopolitical risk.
Others argue that risk-off conditions could temporarily reduce investor appetite for volatile assets like cryptocurrencies.
As Kyle Doops noted, if the macro environment were calmer, Bitcoin’s current chart structure could easily transition into a relief rally. However, given the uncertain global backdrop, downside risks cannot yet be completely dismissed.
Oil Prices and Macro Risk Factors
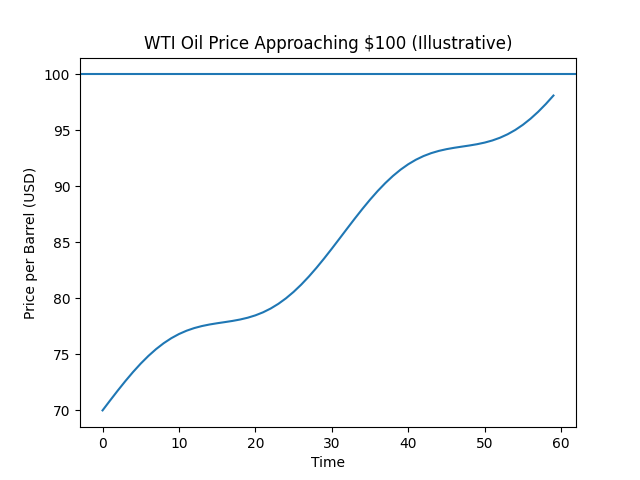
(Chart showing WTI oil approaching $100)
Institutional Flows and ETF Demand
Beyond technical and macro considerations, institutional participation continues to shape Bitcoin’s market dynamics.
Since the approval of spot Bitcoin ETFs in the United States earlier in 2024, institutional capital has increasingly entered the market. These ETFs allow traditional investors—including pension funds, asset managers, and family offices—to gain exposure to Bitcoin without directly holding the underlying asset.
Recent reports from asset management firms indicate that ETF inflows remain a major driver of market demand, absorbing significant portions of newly mined Bitcoin supply.
This structural demand may help explain why Bitcoin has been able to maintain strong price levels even during periods of profit-taking.
Additionally, the next Bitcoin halving—expected in 2028 following the most recent cycle—continues to reinforce the asset’s long-term scarcity narrative.
What Comes Next for Bitcoin?
The coming weeks may prove critical for Bitcoin’s trajectory.
If the market successfully holds above $70,000 on the weekly timeframe, it would confirm the recovery of a key support level that has historically preceded major bullish expansions.
A sustained move above $75,000–$80,000 could trigger renewed momentum as traders begin targeting new all-time highs.
However, the path upward is unlikely to be smooth. Profit-taking, macroeconomic uncertainty, and shifting liquidity conditions will continue to produce short-term volatility.
For investors and builders interested in the practical use of blockchain technology, Bitcoin’s resilience above long-term support levels may reinforce the broader thesis that digital assets are becoming a foundational component of the global financial system.
Conclusion
Bitcoin’s push above $70,000 represents more than a simple price milestone. It marks a potential recovery of long-term support levels that could define the next phase of the cryptocurrency market.
Technical indicators such as the 200-week EMA, the recovery of previous cycle highs, and a sequence of bullish daily candles all suggest that the broader trend remains intact. At the same time, macroeconomic uncertainties—from oil price shocks to geopolitical instability—continue to influence investor sentiment.
For traders and investors searching for the next opportunities in digital assets, the current market environment offers both promise and complexity. If Bitcoin successfully consolidates above $70,000 and eventually breaks through the $75,000–$80,000 resistance range, the stage could be set for a new expansion phase in the cryptocurrency market.
In that sense, the current moment may represent not merely a recovery—but the early formation of the next major chapter in Bitcoin’s long-term evolution.
