
Main Points :
- Bitcoin briefly approached $74,000, marking its highest level in about five weeks after the latest U.S. inflation data matched expectations.
- The Personal Consumption Expenditures (PCE) index, the Federal Reserve’s preferred inflation gauge, showed inflation rising 0.3% month-over-month and 3.1% year-over-year, aligning with forecasts.
- Stable inflation data boosted risk appetite, helping both equities and cryptocurrencies rise.
- Analysts identify a potential resistance zone between $76,000 and $79,000, which could trigger renewed momentum in the altcoin market if broken.
- Some traders warn about bearish signals, including RSI divergence and declining trading activity.
- Institutional flows, ETF demand, and macro liquidity trends continue to support long-term bullish sentiment toward Bitcoin.
The Return of Risk Appetite: Bitcoin Climbs Toward a Key Resistance Zone
Bitcoin has once again captured the market’s attention as it approaches its highest levels in over a month. The catalyst behind this renewed bullish momentum was the release of the U.S. Personal Consumption Expenditures (PCE) inflation index, which showed inflation moving largely in line with market expectations.
Following the announcement, Bitcoin prices briefly surged to approximately $74,000, marking the strongest price range in about five weeks. This move occurred during the Wall Street trading session and coincided with a modest rally in U.S. equities, which climbed roughly 0.5% on the day.
The PCE index is particularly significant because it is widely regarded as the Federal Reserve’s preferred measure of inflation. Unlike the more commonly cited Consumer Price Index (CPI), the PCE index reflects changes in consumer spending behavior and is therefore considered a more comprehensive gauge of inflationary pressure in the U.S. economy.
According to data from the U.S. Bureau of Economic Analysis, the January PCE reading rose 0.3% month-over-month and 3.1% year-over-year, exactly matching market expectations.
While the annual inflation rate remains higher than ideal, the fact that it did not exceed forecasts reassured investors. Financial markets interpreted the data as a sign that inflation remains manageable and unlikely to force immediate aggressive monetary tightening.
This perception helped boost risk assets, including stocks, cryptocurrencies, and growth-oriented technology assets.
Bitcoin Price Reaction to PCE Data
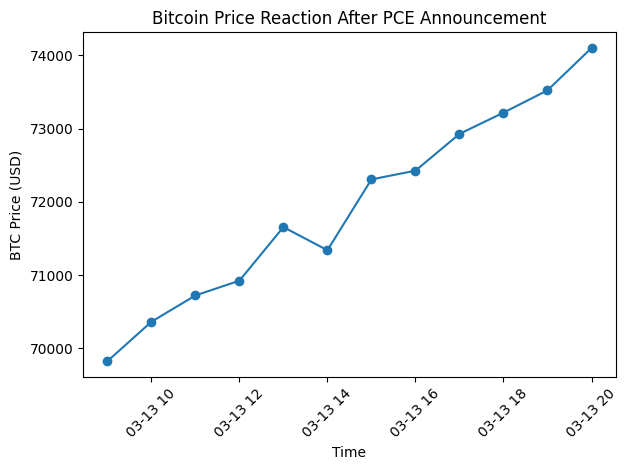
Description: Line chart showing BTC price movement from $70,000 to $74,000 during the hours following the PCE announcement.
Decoupling from Oil: A Changing Macro Relationship
An interesting development following the PCE release was a decoupling between cryptocurrencies and oil prices.
In recent weeks, Bitcoin and other risk assets had shown a temporary correlation with energy markets, particularly West Texas Intermediate (WTI) crude oil, as investors treated inflation-sensitive commodities and crypto as macro-driven assets.
However, on the day of the PCE release, oil prices fell roughly 2% to around $95 per barrel, while Bitcoin and equities moved higher.
This divergence suggests that investors are increasingly viewing Bitcoin not merely as a speculative asset but as part of a broader risk-on investment basket that reacts to macroeconomic expectations.
If inflation continues to stabilize while economic growth remains resilient, Bitcoin could benefit from the same macro tailwinds that typically support technology stocks and venture capital flows.
Bitcoin vs Oil Correlation Shift
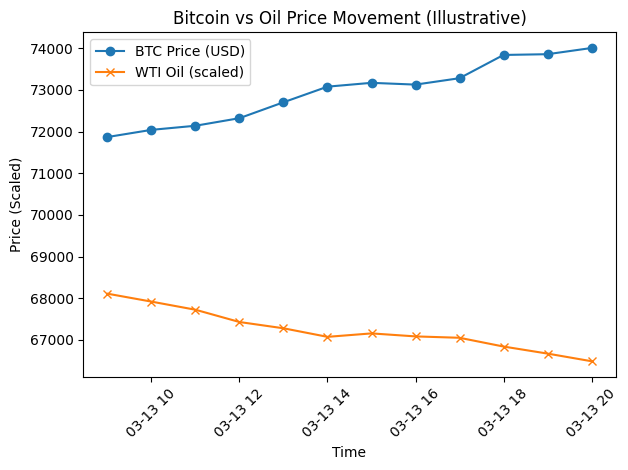
Description: Dual line chart comparing BTC price movement with WTI oil price movement over the same trading day.
The Critical Resistance Zone: $76,000 to $79,000
Despite the bullish sentiment triggered by the PCE data, market analysts remain cautious.
Crypto analyst Michaël van de Poppe noted that Bitcoin faces a key resistance zone between $76,000 and $79,000.
According to his analysis, Bitcoin is unlikely to break through this range immediately. However, if the market enters that zone, it could have broader implications for the entire crypto ecosystem.
Historically, strong Bitcoin rallies often trigger altcoin momentum phases, during which smaller crypto assets outperform Bitcoin in percentage gains.
Van de Poppe suggested that if Bitcoin reaches the upper end of the resistance range, it could form a bullish engulfing pattern on the monthly chart, effectively reversing the correction seen earlier in February.
Such a technical pattern would strengthen the case for continued bullish momentum heading into the next quarter.
For investors seeking the next generation of crypto assets, this potential shift could signal the beginning of a new altcoin cycle — a period historically associated with significant gains in sectors such as:
- DeFi infrastructure
- AI-related blockchain projects
- Layer-2 scaling solutions
- Real-world asset tokenization platforms
Bitcoin Resistance Levels
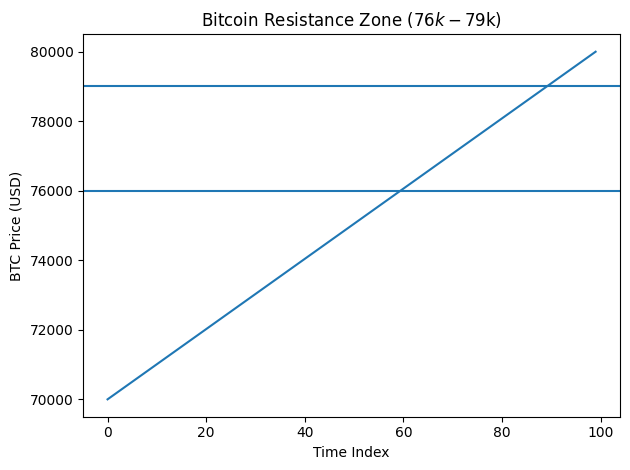
Description: Technical chart highlighting resistance between $76k and $79k with the 50-day moving average.
Bearish Warnings: Technical Indicators Flash Caution
Not all traders share the optimistic outlook.
Several market participants have pointed to technical indicators suggesting caution.
Trader Daan Crypto Trades warned that if the current price range breaks downward, it could trigger a sharp market correction.
Another trader known as Roman described the recent rally as potentially being a “bearish retest.”
His concerns are based on three primary technical signals:
- RSI bearish divergence
- Price rising while trading volume declines
- MACD indicator reset
RSI divergence occurs when the price rises but the momentum indicator fails to confirm the move, suggesting weakening underlying strength.
Meanwhile, declining trading volume during price increases can indicate that the rally lacks broad market participation.
If these signals intensify, Bitcoin could experience a short-term correction before resuming its longer-term trend.
Open Interest and Market Liquidity
Another important metric being closely monitored is open interest (OI) in Bitcoin derivatives markets.
Analyst Filbfilb highlighted that declining open interest could indicate fading bullish momentum.
Open interest refers to the total number of active futures or options contracts in the market.
When prices rise while open interest falls, it can indicate that traders are closing positions rather than opening new ones — a potential warning sign.
However, current market data suggests that this pattern has not yet emerged clearly.
Bitcoin is currently interacting with its 50-day simple moving average, a level that has historically acted as a key resistance point during previous breakout attempts.
If Bitcoin successfully breaks above this level with strong volume, it could confirm a continuation of the broader bull market.
Bitcoin Open Interest vs Price
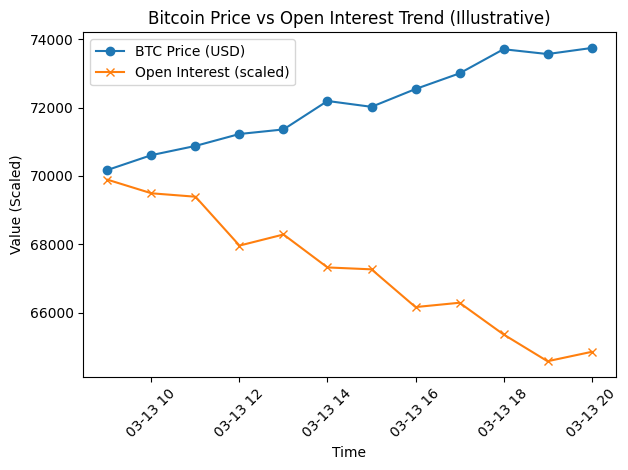
Description: Chart comparing BTC price with derivatives open interest trends.
The Broader Crypto Landscape: Institutional Flows and ETF Demand
Beyond technical indicators and short-term trading patterns, the broader macro environment remains supportive for cryptocurrencies.
Over the past year, several structural developments have strengthened Bitcoin’s long-term outlook:
1. Institutional Bitcoin ETFs
The launch of spot Bitcoin exchange-traded funds has introduced massive institutional capital flows into the crypto market.
Major asset managers including BlackRock, Fidelity Investments, and Ark Invest have launched Bitcoin ETFs that allow traditional investors to gain exposure to BTC through regulated financial markets.
These ETFs have collectively accumulated tens of billions of dollars worth of Bitcoin, tightening available supply in the market.
2. The Post-Halving Supply Dynamics
Bitcoin’s most recent halving event reduced the block reward from 6.25 BTC to 3.125 BTC, further tightening supply.
Historically, halving cycles have often preceded major multi-year bull markets.
3. Rising Stablecoin Liquidity
Stablecoin market capitalization has also begun rising again, indicating new capital entering the crypto ecosystem.
Higher stablecoin liquidity typically precedes increased trading activity and altcoin speculation.
Institutional Bitcoin ETF Inflows
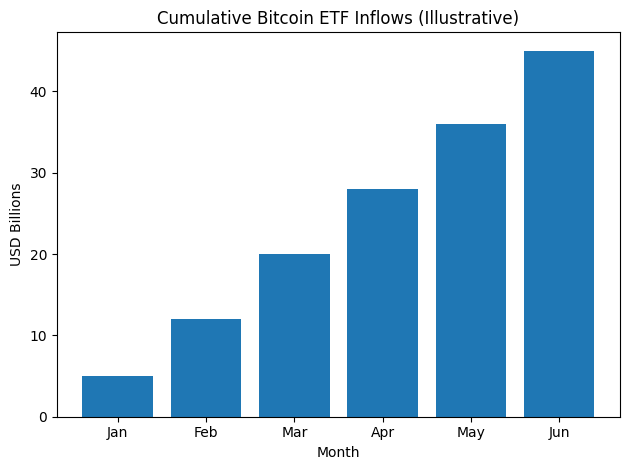
Description: Bar chart showing cumulative ETF inflows over time.
Opportunities for the Next Crypto Cycle
For investors searching for new crypto assets, revenue opportunities, or practical blockchain applications, the current environment presents several emerging sectors.
These include:
Real-World Asset Tokenization
Financial institutions are increasingly exploring blockchain technology to tokenize traditional assets such as bonds, real estate, and commodities.
Layer-2 Scaling Ecosystems
Ethereum scaling solutions continue to attract developer activity and venture capital.
AI and Blockchain Integration
Projects combining decentralized infrastructure with AI computation networks are rapidly gaining attention.
Decentralized Payments
Stablecoin-based payment rails are expanding globally, potentially reshaping cross-border finance.
Conclusion: A Market Balancing Optimism and Caution
Bitcoin’s climb toward a five-week high reflects growing optimism across global financial markets.
The latest inflation data provided reassurance that macroeconomic conditions remain stable enough to support risk assets.
However, the path forward is unlikely to be linear.
Technical indicators suggest that Bitcoin may face significant resistance between $76,000 and $79,000, and a temporary correction remains possible.
Yet when viewed in the broader context of institutional adoption, ETF inflows, and post-halving supply dynamics, the long-term trajectory of Bitcoin appears increasingly strong.
For investors and builders within the blockchain ecosystem, the current phase may represent the early stages of the next crypto expansion cycle.
If Bitcoin successfully breaks its key resistance levels, it could ignite a broader rally across the digital asset market — potentially opening the door to the next generation of blockchain innovation and investment opportunities.
